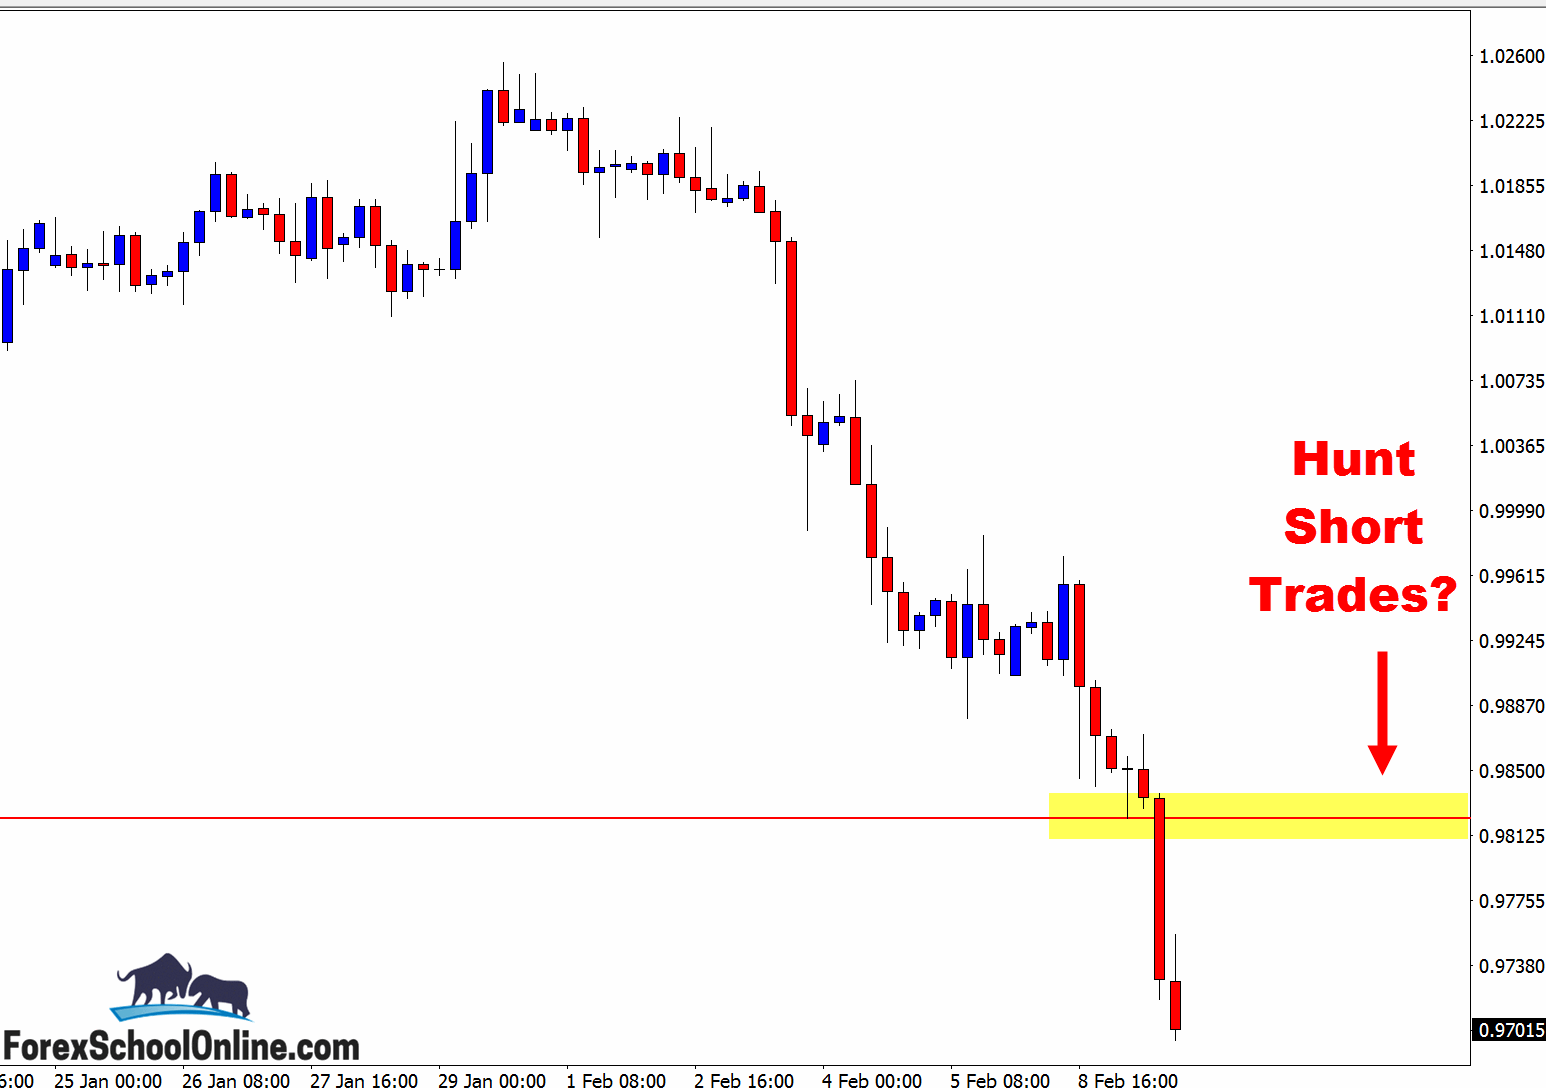
As I write this daily Forex summary for you, price on the daily chart of the USDCHF is getting absolutely SLAMMED lower. As you can see on my daily chart below; price is currently breaking out lower and through a daily support level.
This level is a crucial level that has been a major price action flip level in the past, holding as both a support and resistance level on the daily chart. Now that price is looking to break this level once again, we can watch to see if this level flips and goes from an old support to new resistance.
With this really strong recent momentum lower and crucial level, any potential signs of retracement higher or pull-backs into value could be opportunities to hunt for potential short trades. I discuss the how’s and why’s of hunting high probability price action trades at ‘Value Areas’ in the lesson;
How Professional Traders Enter From Value Areas & Hunt Stops
The potential new resistance level could be a really solid area to target short trades. Should price rotate back higher and into the old support/new resistance area, not only would targeting trades at this area be at a key level, but it would also be trading with the recent short-term momentum lower.
We would have to hunt short trades on intraday time frame charts such as the 8 hour, 4 hour, 1 hour or potentially lower because whilst even though the major level is on the daily chart, to take a reversal setup we need space and for the trade to be at a swing point, and in this case a swing high.
Price would not have enough room on the daily chart to make a swing point and create space to trade into with this scenario.
If you don’t understand this fully, don’t worry as I have a video that explains it as clear as mud here; Video Trading Lesson
And if you have any questions on anything discussed today, either put it in the comments below or send me an email to Contact Us.
See charts below;
Daily Chart – Zoomed Out

Daily Chart – Major Daily Level

4 Hour Chart – Short Trades?

Related Forex Trading Education


Leave a Reply