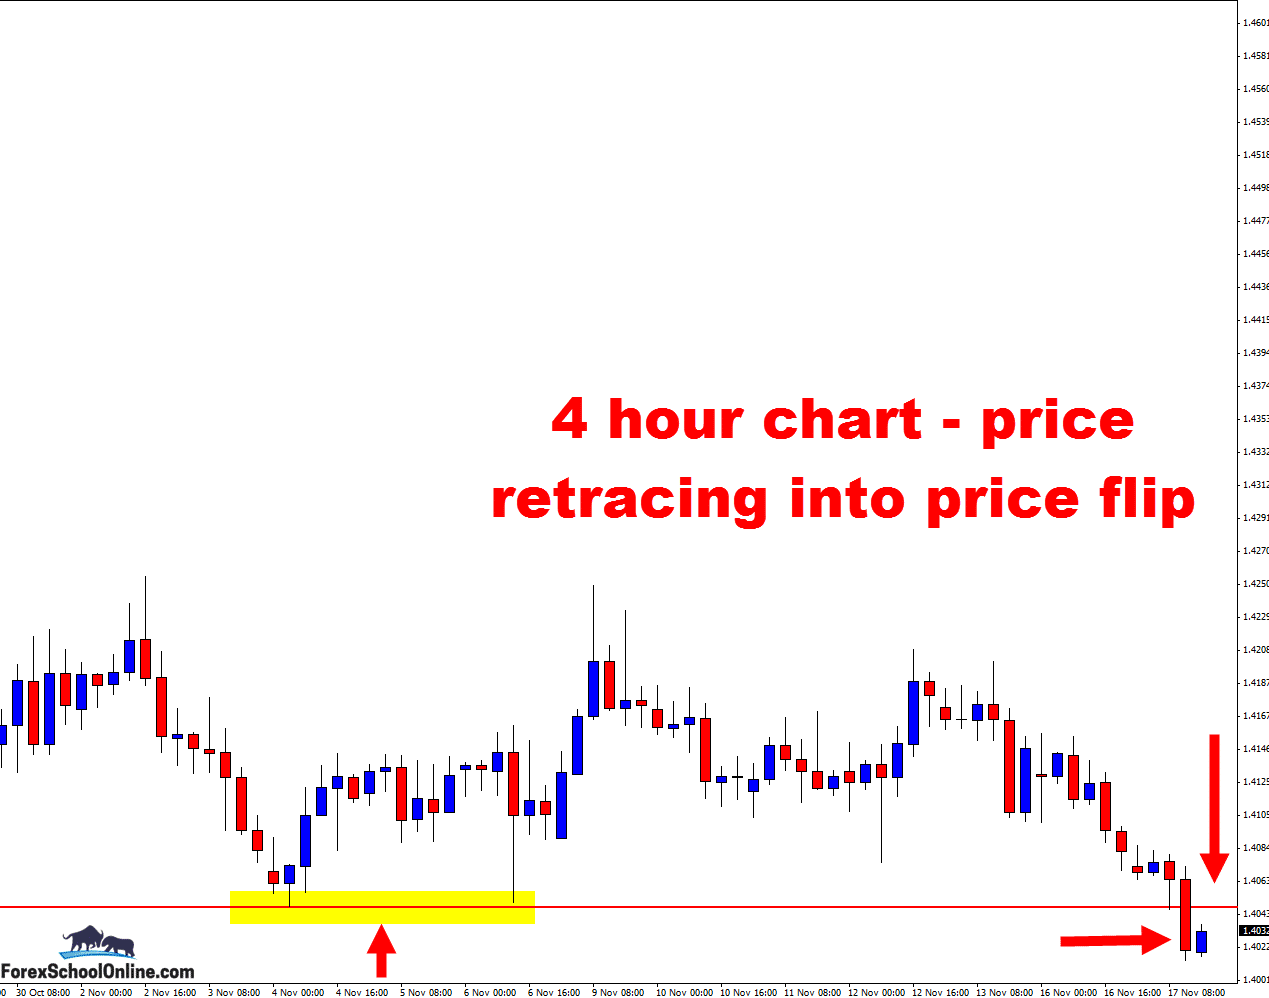
Price on the CHFSGD 4 Hour price action chart is racing higher and into the overhead resistance, as I write this daily Forex commentary for you. This overhead resistance level is a super important price action flip level that has acted as both a support and resistance level, going right back over the longer term.
This 4 hour resistance level that price is now moving back higher into is also a major daily level. If you flip to your daily chart, you will see that on the daily chart, price is attempting to try and breakout and move lower through this level. It can be odd how all the different levels intersect and work with each other.
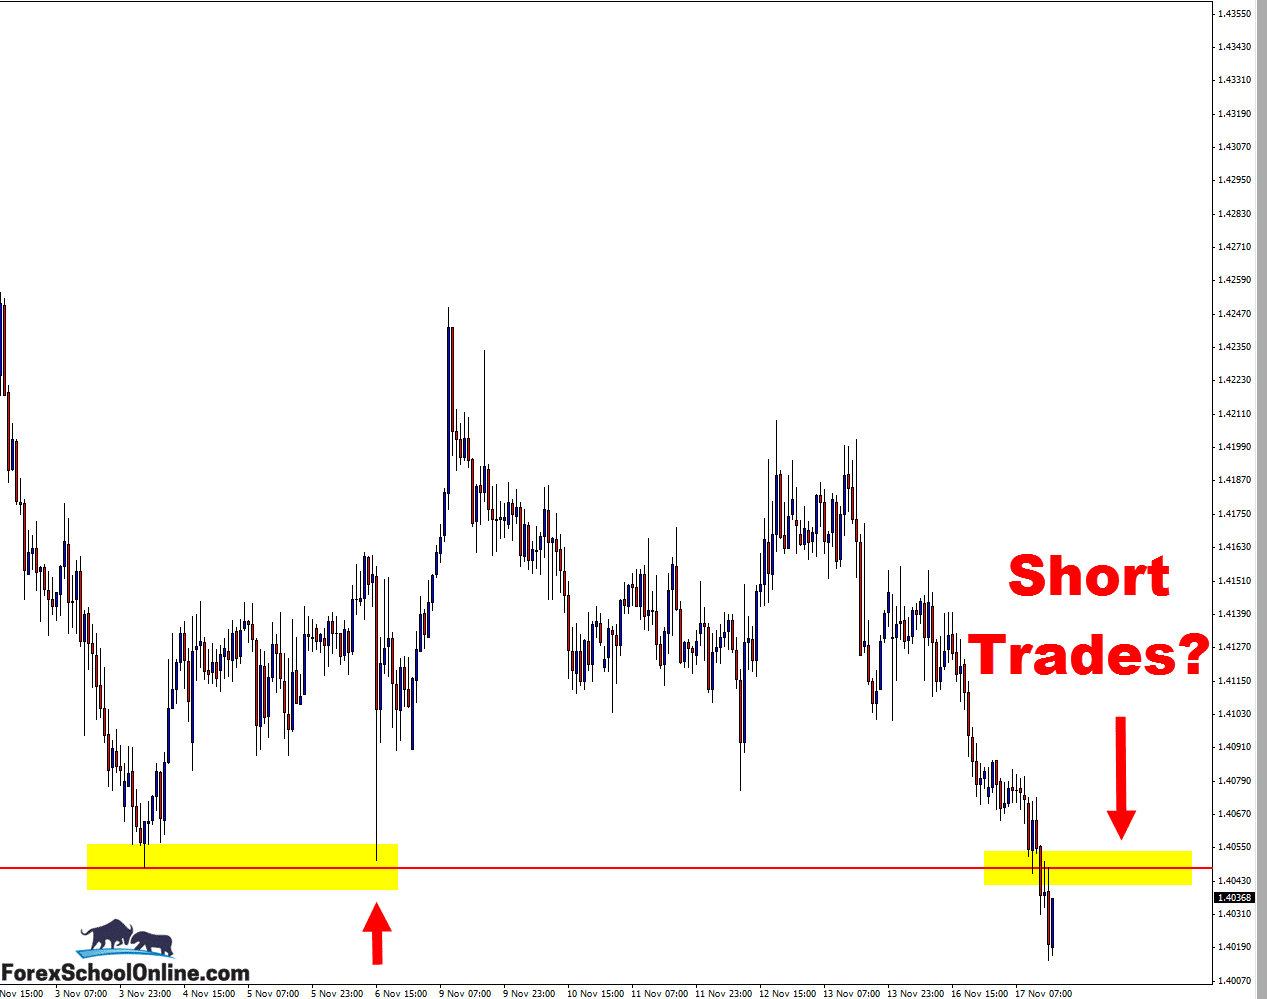
This level could now be a great level to watch the smaller time frames to hunt potential short trade setups. A really good strategy that could be used in this scenario is the “First Test of Support or Resistance”.
Basically, what we are looking for is, now that we have seen price breakout lower and through the 4 hour chart, and we have seen price close out and below the 4 hour chart, we can then start to look for really quick retraces back into the old support area to make a “first test” of the old support area and potential new resistance.
You can read more about exactly how this strategy works in the trading lesson; Making High Probability Trade Setups With the First Test of Support or Resistance
So, if price can make a quick retrace back higher and back into the old support and new price flip resistance, then we can watch the price action behavior on the smaller time frames. How small of time frame you go is up to you and how comfortable you are. You may go to the 1 hour or 30 minute or even 15 minute. For more of a guide on how you should be using the different time frames and what is recommended, see here: Trading the Daily Charts Down to the 15 Minute Charts
4 Hour Chart – Price Flip Level

1 Hour Chart – Short Trades?


Leave a Reply