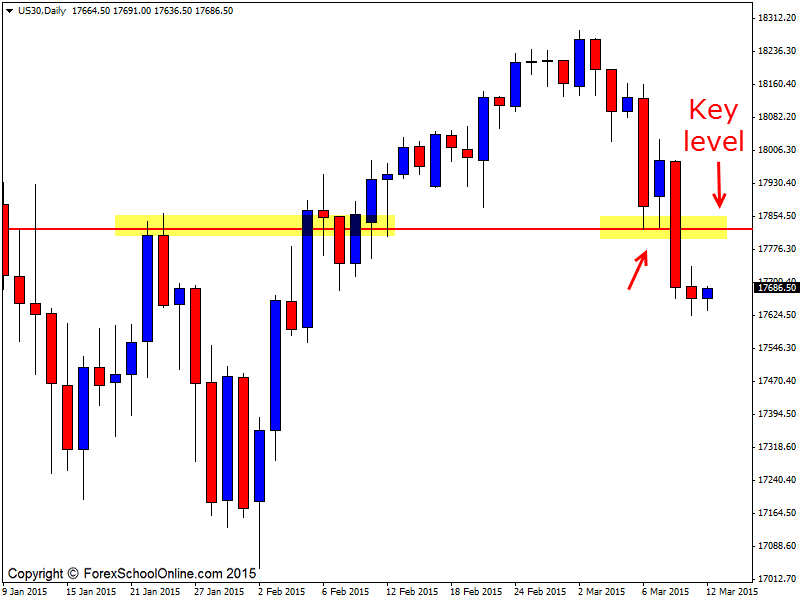
Price in the past two days on the US 30 or the Dow Jones has smashed through a crucial support level on the daily price action chart and most importantly remained closed below. As the daily chart shows below; this level has acted as a previous resistance and “flipped” to act as a support level, with the very real potential for it to now flip again and act as a new resistance once again.
Price has been moving lower in the last week when it paused and found support at this key level. Price paused for two sessions or daily candles before continuing and breaking through and moving lower.
Now is where it becomes interesting and crucial for where price goes next over the coming days and weeks. This is also where this level becomes key. If price does retrace higher and look to re-test this old support/new resistance level it could become a great level for traders to hunt high probability short setups.
Traders would need to read the price action story and read the price action behavior of the chart to ensure that price is looking to sell off at the new resistance and this can be done by looking for A+ bearish trigger signal such as the ones taught in the Forex School Online courses.
If this new resistance level does hold, then it could mean price may make another strong move lower and into the next near term support level in the coming days which traders could then watch out for.
US Wall Street 30 Index Daily Chart

Related Forex Trading Education
– Are You Sick of Losing Money Trading? Turn Your Trading Around With These Simple Strategies


Leave a Reply