• Skip to primary navigation
  • Skip to main content
  • Skip to primary sidebar
  • Skip to footer

ForexSchoolOnline.com

Learn to Trade Forex Online

  • Compare Brokers
    • Broker Type
      • Paypal Brokers
      • Swap-Free Brokers
      • Low Spread Brokers
      • ECN / STP Brokers
      • Market Maker Brokers
      • Non Dealing Desk Brokers
      • Low Minimum Deposit Brokers
    • Country
      • Brokers for Australia
      • Brokers for South Africa
      • Brokers for the UK
      • Brokers for the US
      • Brokers for Nigeria
    • Regulation
      • FCA Regulated Brokers
      • ASIC Regulated Brokers
      • FSCA Regulated Brokers
      • CFTC Regulated Brokers
    • Platform
      • MT4 Brokers
      • MT5 Forex Brokers
    • Strategies
      • Hedging Forex Brokers
      • Scalping Forex Brokers
      • Carry Trade Forex Brokers
      • Brokers for Indicators and EA’s
  • Start Here
    • Start Trading Guide
    • Beginner Trading Lessons
  • Free Forex Course
    • Public Login
    • Register
    • Password recovery
  • Lessons
    • Strategies
    • Videos
    • MT4 Guides
    • Money Management
  • Trade Setups
  • Tools
    • Correct Free Demo Charts
    • Forex Journal Download
    • Position Size Calculator
    • FULL List of Tools
    • Forex Demo Accounts
  • Price Action Guide
  • Free Course
Johnathon Fox
02/18/2015 | UPDATED ON: 08/05/2019

Large Bearish Engulfing Bar Printed on Gold v Euro | 18th Feb 2015

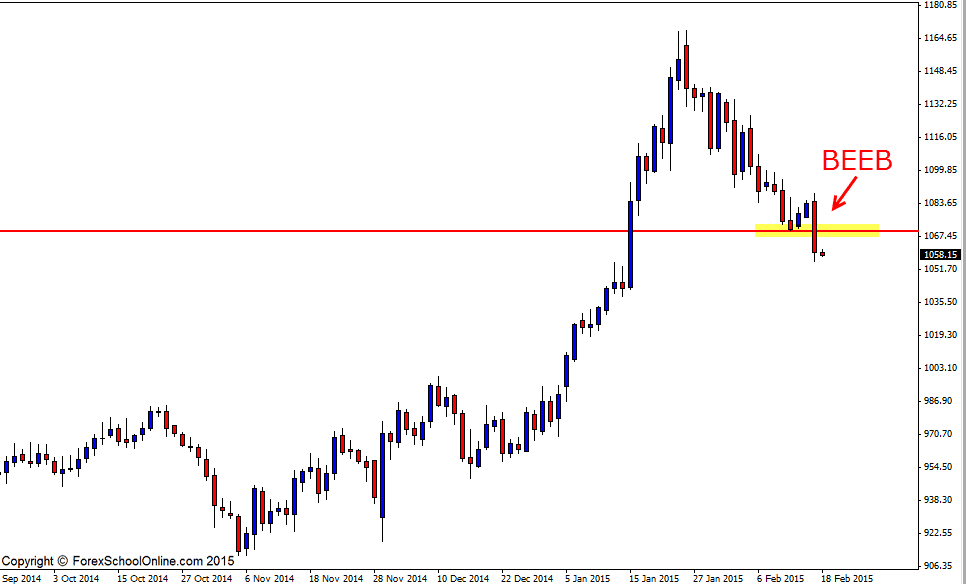
Price has formed a large Bearish Engulfing Bar (BEEB) on the XAUEUR Daily chart or the Gold v Euro chart. This BEEB is large and commanding and whilst it is not at a strong pull-back or place of value where we would like to see our reversal trigger signals, we can still use this price action information to read the chart and give us potential clues as to what price is looking to do next.

You will see that this Bearish Engulfing Bar is engulfing the previous two candles and that price closed strongly with the close being in the very last bottom 1/3 of the candle. Where price closes on engulfing bars is super important and can often be the difference of whether a setup is able to be traded of not.

For example; if a bearish engulfing bar has all the textbook makings for a high probability setup i,e it is up at a swing high, rejecting a major daily resistance, has lots of room to move into and is also a nice large bearish engulfing bar, it would be important where price closes. If this bearish engulfing bar closes in the top 1/3 of the candle, rather than the bottom 1/3 of the candle, then it would make it an unplayable setup simply because of how price closed. In this scenario price would have showed us that it closed very strongly with the bulls in control when we were looking to take a bearish setup and go short and for price to move lower.

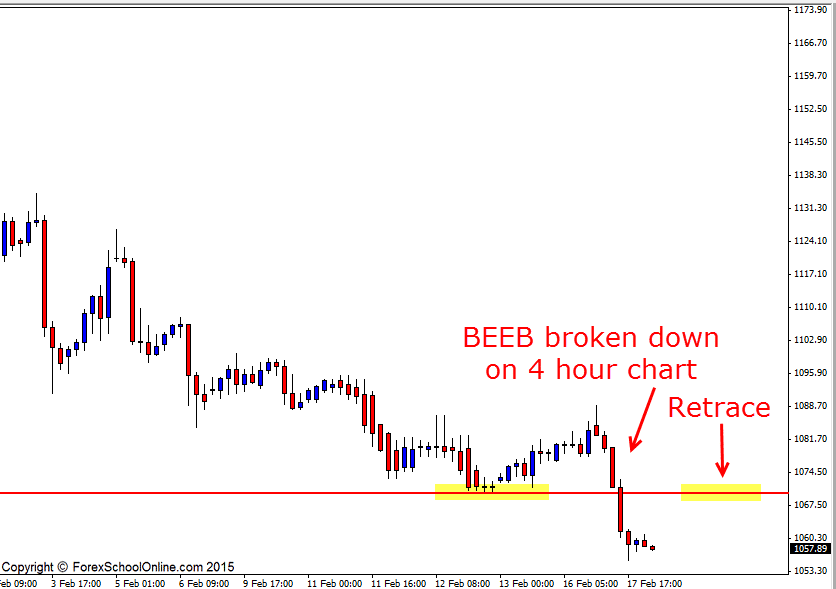
Now that price has printed off a BEEB in this market there appears to be two levels to keep an eye on. The first is the retrace level I have marked on the 4 hour chart below; If price can move into this level back higher, then this could be a really solid level to look for short trades on intraday charts such as the 4 hour or even 1 hour time frames.

The other level is the 1043.25 and this is the next major daily support. If price can break the low of the BEEB and gain some momentum, then it may be able to move into this next daily support area where you should keep an eye on it.


Gold v Euro Daily Chart

Euro Engulfing Bar


Gold v Euro 4 Hour Chart

Gold v Euro Bearish Engulfing Bar


Related Forex Trading Education

– How to Make Money Forex Price Action Trading

Recommended Broker

  • Broker
  • Min Deposit
  • Benefits
  • Score
  • Visit Broker

$200

T&Cs Apply
  • The Lowest Trading Costs
  • 50% Welcome Bonus
  • Award-winning 24 Hour Support
5
Trade Now FreeBets Reviews
Reviews

About Johnathon Fox

Johnathon is a Forex and Futures trader with over ten years trading experience who also acts as a mentor and coach to thousands and has written for some of the biggest finance and trading sites in the world.

View all posts by Johnathon Fox →
Previous Post: « NZDUSD Breaks Out of Price Action Containment & is Grinding Higher | 17th Feb 2015
Next Post: Gold v Euro Fires Off Super High Probability 2 Hour Pin Bar | 20th Feb 2015 »

Reader Interactions

Comments

  1. Senzo says

    02/20/2015 at 6:04 AM

    Hello Johnathan

    I want to know since you not use the indicators what do you use to see if the market is oversold or overbought?

    Senzo

    Reply
    • Johnathon Fox says

      02/20/2015 at 9:45 PM

      Hello Senzo,

      We are reading the price action and the overall story of that chart to tell us when price is in a area of value to make a trade.

      The overbought/oversold indicators are being made directly from the historical price on the chart right in front of us to give us some sort of reading so we are better off reading the live price as it is being printed.

      The other thing is once we understand the super common market principles that repeat themselves we can learn to carry these out over and over again. These will be things like trading with a strong trend over and over and over again and often in this situation we will be going directly against what an indicator would be suggesting, but it would be the high probability play.

      Safe trading,

      Johnathon

      Reply

Leave a Reply Cancel reply

Your email address will not be published. Required fields are marked *

Primary Sidebar

Forex School Online

High Probability Price Action Trading

How to make, manage and take profit from trades in the markets

Start Learning (It's Free!)

Turn Your Trades into Winners!

The Price action course is the in-depth advanced training on assessing, making and managing high probability price action trades.

Sign up for Free!

Recommended Broker

  • Broker
  • Min Deposit
  • Benefits
  • Score
  • Visit Broker

$200

T&Cs Apply
  • The Lowest Trading Costs
  • 50% Welcome Bonus
  • Award-winning 24 Hour Support
5
Trade Now FreeBets Reviews
Reviews

Footer

Get Our FREE Course, Bonus Strategies & Indicators!
X
Join Us Now!

Your capital is at risk.

X

CORNERSTONE LESSONS

Forex Trading for Beginners

Price Action Trading

How to Trade Forex

Technical Analysis

Forex Charts

Forex Trading Strategies

Money Management 

Compare Brokers

Best Forex Brokers

Forex Demo Accounts

Best Forex Trading Platforms

Forex Apps

Swap Fee Accounts

MT4 Brokers

CATEGORIES

Forex Videos

Trading Lessons

Weekly Trade Ideas

Start Here Guide

ForexSchoolOnline.com helps individual traders learn how to trade the Forex market

WARNING: The content on this site should not be considered investment advice and we are not authorised to provide investment advice. Nothing on this website is an endorsement or recommendation of a particular trading strategy or investment decision. The information on this website is general in nature so you must consider the information in light of your objectives, financial situation and needs.

Investing is speculative. When investing your capital is at risk. This site is not intended for use in jurisdictions in which the trading or investments described are prohibited and should only be used by such persons and in such ways as are legally permitted. Your investment may not qualify for investor protection in your country or state of residence, so please conduct your own due diligence or obtain advice where necessary. This website is free for you to use but we may receive a commission from the companies we feature on this site.

We Introduce people to the world of currency trading. and provide educational content to help them learn how to become profitable traders. we're also a community of traders that support each other on our daily trading journey

Forexschoolonline.com is not a financial advisor. Do your research before investing your funds in any financial asset or presented product or event. We are not responsible for your investing results.

Copyright © Forex School Online Sitemap  - Privacy Policy - Disclaimers & Terms of Use - CONTACT US