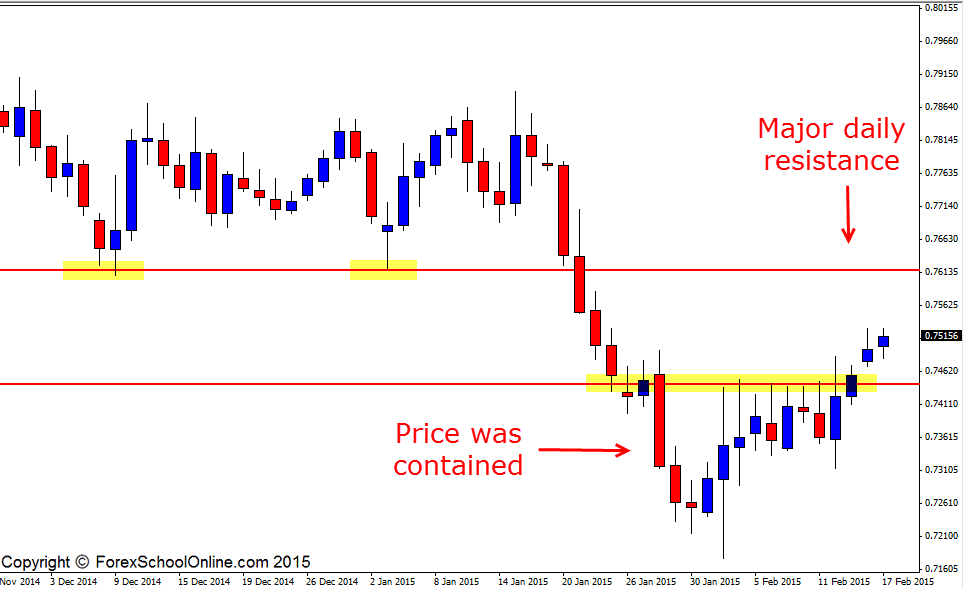
Price has now broken out higher on the NZDUSD after price had been contained below a really relevant daily resistance level. As the daily chart shows below; the bulls were making consistent pushes to try and move through this resistance.
For eight days in a row price tested this resistance level with most of these eight candles having their wicks moving right up to the key daily resistance and being rejected. As I go through in more detail in; The Secrets Traders Can Learn From Candlesticks and Price Action traders can learn a heck of a lot from where price can and cannot close above or below.
Where candle wicks close or where price closes tells us a lot and this daily chart is the same. If we look at the daily chart below; we can see that the wicks of the daily candles were repeatedly testing the resistance level and at one stage one of the candle wicks moved much higher and through the key resistance. The key thing to note however is that the level is not broken until price has broken and closed above or below the key level and in this case above the key resistance level.
So even though the candle wick had moved well above the key resistance, price had not closed above the containment or resistance level. We then saw in the next candle price move higher and importantly close out and above the resistance and from here price has grinded higher.
This is how we can also trade price flip levels. We need to continue to watch for this same old resistance to now hold as a new support level.
Now that price has broken this major containment area on the daily chart, price could gather momentum and roll higher into the major daily resistance around the 0.7615 area. This could be a very high probability area to look for short trades on either daily or smaller intraday charts, should price action fire off any bearish price action trigger signals such as the ones taught in the Forex School Online Price Action Courses.
NZDUSD Daily Chart


Leave a Reply