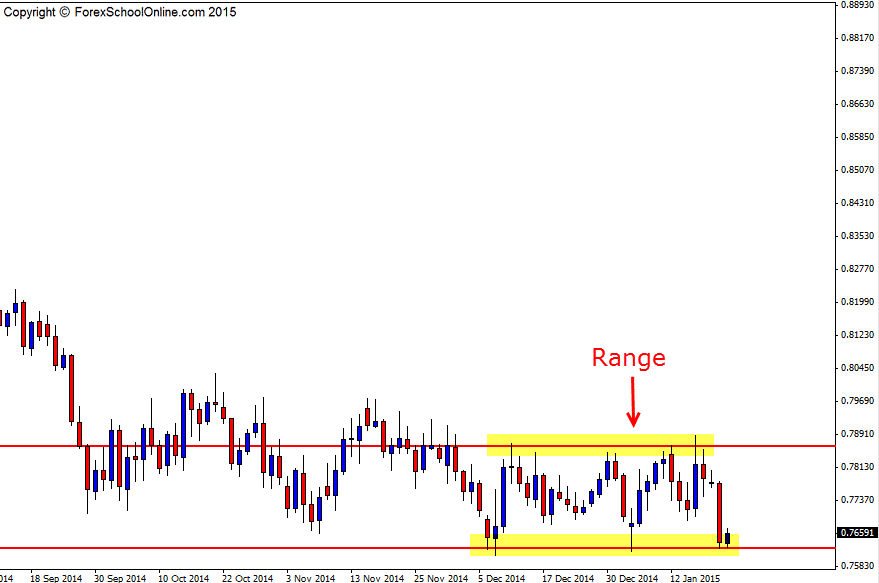
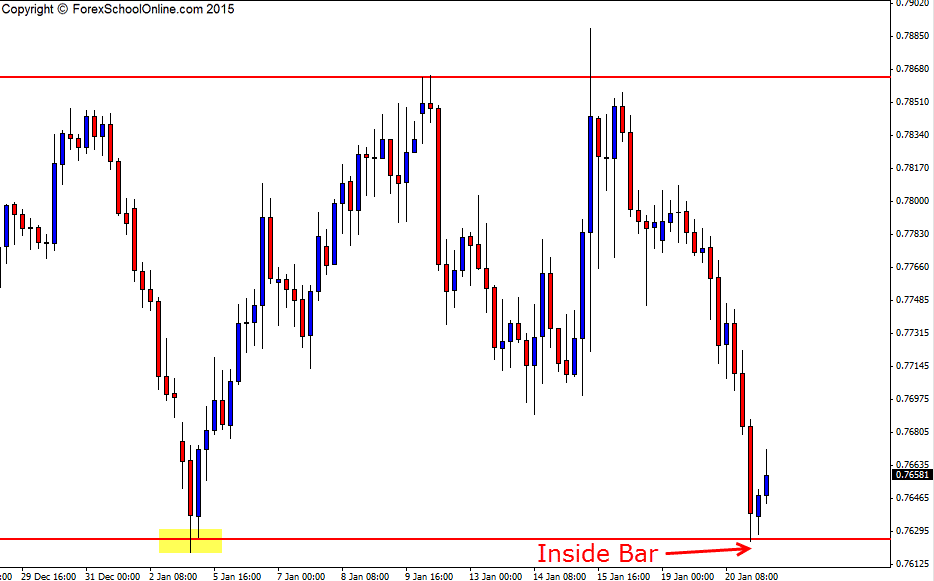
The NZDUSD has formed a 4 hour chart Inside Bar (IB) at the bottom of a major daily range where price has now been contained for the previous three months. As the daily chart shows below; price on the daily chart was previously in a strong down trend making clear lower lows, but price has since moved into this range and has been unable to make a clean break past the major support around the 0.7625 area.
As I write up this post, price has just fired off the inside bar on the 4 hour chart. The inside bar is formed down at the low, rejecting the major daily support level that is also the range low. This price action could be crucial as to where price goes in the coming sessions and days for this pair.
Overhead on the 4 hour chart there are a lot of trouble areas that could prove to act as resistance levels. This is often the case with ranges and sideways trading markets. Because price is not moving in a clear trend or one direction, price chops up and down and this means it creates a lot of different trouble areas or support and resistance areas.
These areas are also what we refer to as traffic. This is also why when price is trading in a range it will tend to continue to range and why when price is in a trend it will continue to trend. If price is moving back into a range it is moving back into more traffic and more trouble areas which means it is going to have to deal with more areas of supply/demand to work through just to make a move. You can read more about this in-depth in the trading lesson;
Trading Price Action in Sideways and Ranging Markets
NZDUSD Daily Chart

NZDUSD 4hr Chart


Leave a Reply