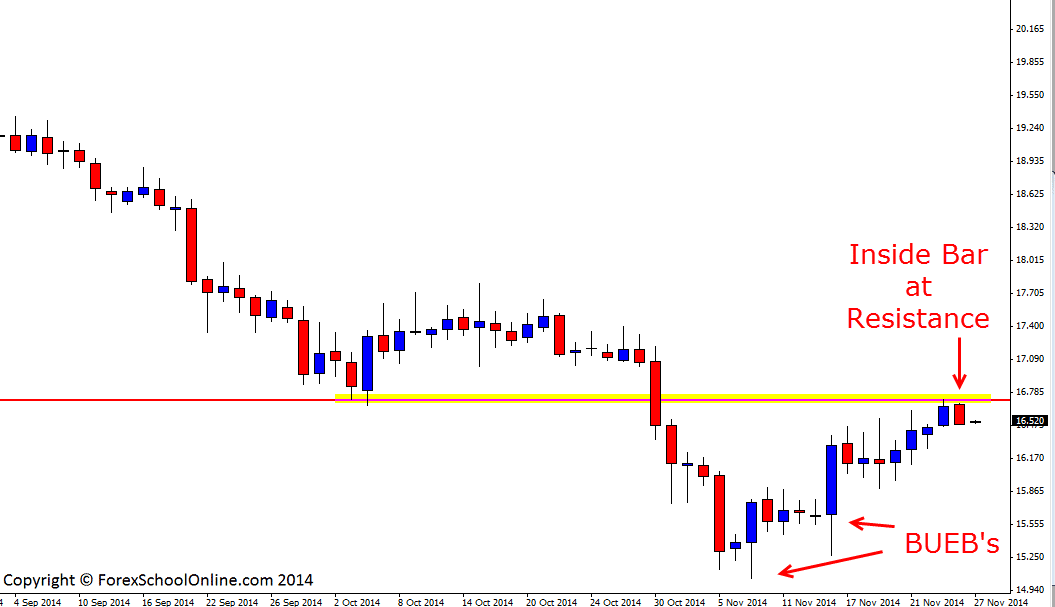
Price on the Silver (XAGvUSD) chart has moved into a key daily resistance and printed off an inside bar. This inside bar has closed lower at the end of the session with price closing right near the session lows indicating a potential rejection of the resistance. Price on the daily chart has been in a strong trend lower, but price in the recent two weeks has started to form a base off the lows. As the daily chart shows below; price has now formed two consecutive bullish engulfing bars (BUEB) each with a higher low.
To take a short setup from this key daily resistance, a bigger bearish rejection and confirmation trigger signal would have meant that there was a more clear indication of the order flow changing to the downside. I discuss how order flow works with price action more in-depth in the trading lesson; Trading Order Flow With Price Action. A bigger and more commanding rejection trigger signal at this level would have also meant that price would have moved below all of the minor support that price is now sitting on-top of. As it is; price has formed a small inside bar and inside bars are indecision candles. Just below this inside bar is a lot of minor levels and candle highs which could act as trouble areas.
This is an interesting market and a market to watch the price action on closely. The trend on the daily chart is still in-tact at this stage, but if price breaks the daily resistance and moves above, then it may be time to change and start looking for long trades. If the level holds, then looking for short setups and continuing to trade with the trend would be the high probability play.
Silver Daily Chart

Related Forex Trading Education
– Read How a Forex School Online Member Become Profitable and The Lessons They Learnt


Leave a Reply