• Skip to primary navigation
  • Skip to main content
  • Skip to primary sidebar
  • Skip to footer

ForexSchoolOnline.com

Learn to Trade Forex Online

  • Compare Brokers
    • Broker Type
      • Paypal Brokers
      • Swap-Free Brokers
      • Low Spread Brokers
      • ECN / STP Brokers
      • Market Maker Brokers
      • Non Dealing Desk Brokers
      • Low Minimum Deposit Brokers
    • Country
      • Brokers for Australia
      • Brokers for South Africa
      • Brokers for the UK
      • Brokers for the US
      • Brokers for Nigeria
    • Regulation
      • FCA Regulated Brokers
      • ASIC Regulated Brokers
      • FSCA Regulated Brokers
      • CFTC Regulated Brokers
    • Platform
      • MT4 Brokers
      • MT5 Forex Brokers
    • Strategies
      • Hedging Forex Brokers
      • Scalping Forex Brokers
      • Carry Trade Forex Brokers
      • Brokers for Indicators and EA’s
  • Start Here
    • Start Trading Guide
    • Beginner Trading Lessons
  • Free Forex Course
    • Public Login
    • Register
    • Password recovery
  • Lessons
    • Strategies
    • Videos
    • MT4 Guides
    • Money Management
  • Trade Setups
  • Tools
    • Correct Free Demo Charts
    • Forex Journal Download
    • Position Size Calculator
    • FULL List of Tools
    • Forex Demo Accounts
  • Price Action Guide
  • Free Course

AUDUSD Fires Off 1hr Pin Bar at Daily Key Level Flip | 3 Oct 2014

Johnathon Fox
10/03/2014 | UPDATED ON: 08/06/2019

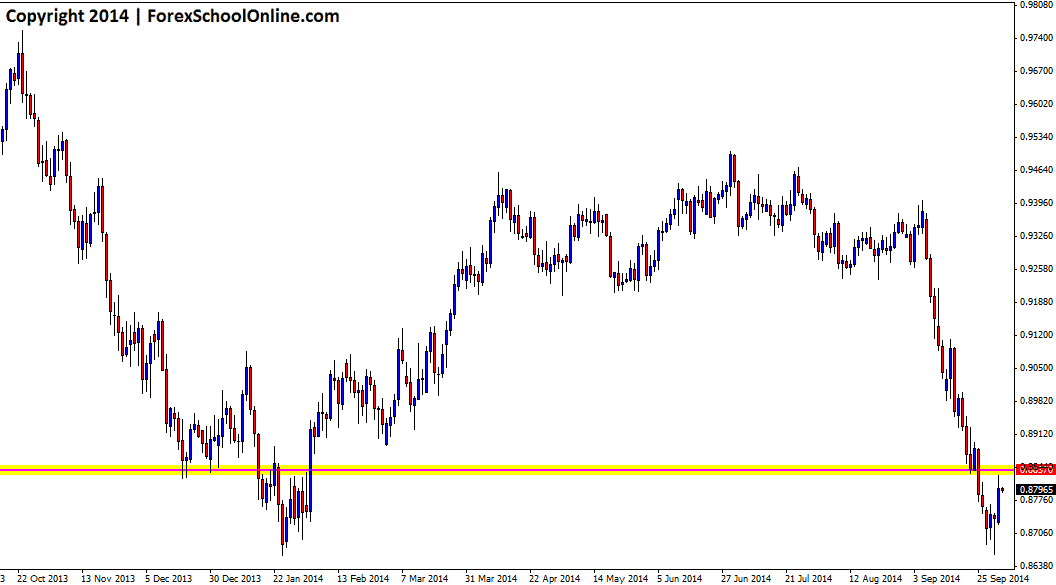
The Aussie (AUDUSD) has fired off a false break pin bar on the 1hr chart that is rejecting a key daily price flip level. This pin bar was formed during the last few hours of the US session and price is now stalled at the started of the Asian session. As the daily chart shows below, price has been smashed lower of late as I discussed earlier in the week in the 30 Sep Daily Market Commentary with price losing over 600 pips in he last three weeks alone. As I went through in that post; the best way to play these types of markets where there is a clear and obvious trend in place is to look for setups with the trend at key value points, rather than to try and fight against it.

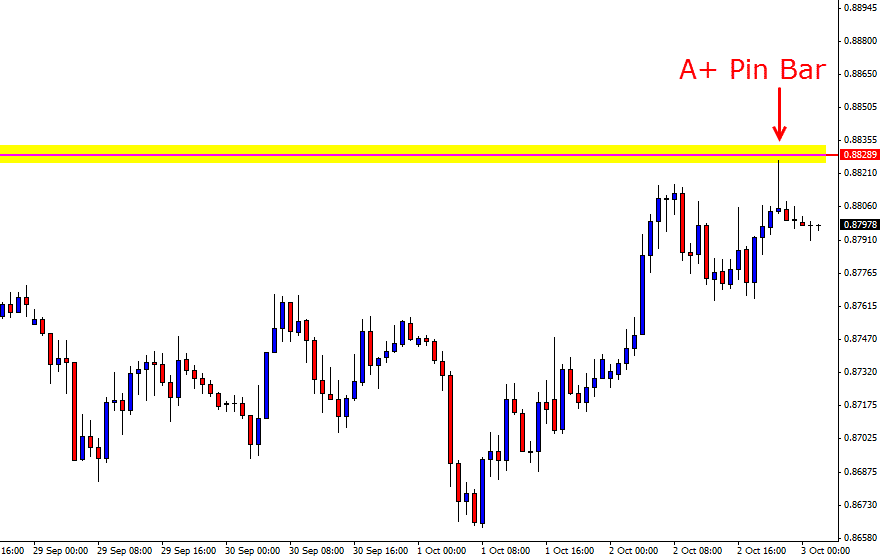
As the 1hr chart shows below; this pin is not only rejecting the daily key resistance and price flip level, but it is also making a false break of the recent 1hr resistance level. There is a bit of traffic below the pin bar for price to get through, but if price can break lower, the near term support looks to come in around the 0.8773 level.

If price moves higher and above the pin bar high, a new short term trend could be on the cards that I discussed to watch out for in the market commentary earlier in the week on the Aussie.


AUDUSD Daily Chart

Daily Aussie chart


AUDUSD 1hr Chart


1 Hour False Break AUDUSD Pin Bar


Related Forex Trading Education

– How to Trade False Break Pin Bar Setups * Live Price Action Video Setup*

Recommended Broker

  • Broker
  • Min Deposit
  • Benefits
  • Score
  • Visit Broker

$200

T&Cs Apply
  • The Lowest Trading Costs
  • 50% Welcome Bonus
  • Award-winning 24 Hour Support
5
Trade Now FreeBets Reviews
Reviews

About Johnathon Fox

Johnathon is a Forex and Futures trader with over ten years trading experience who also acts as a mentor and coach to thousands and has written for some of the biggest finance and trading sites in the world.

View all posts by Johnathon Fox →
Previous Post: « Germany 30 Index Fires Off Inside Bar on Daily Chart | 1 Oct 2014
Next Post: Technical Analysis of Germany 30 Index as Inside Bars Continue | 7th Oct 14 »

Reader Interactions

Comments

  1. Jason says

    10/06/2014 at 10:47 PM

    Hiya Johno

    Loved this trade on the H1. My D1 level was exactly at the 0.8800 level and I usually am put off by price closing the wrong side of my D1 levels so in this case I did wait for it to break lower, with a buffer to get me into the trade. With the trail to break even it did end up coming back to stop me out. What a nice drop though.. shame I wasnt on it! How do you deal with trades that close the opposite side of our daily S/R levels? Trades like this really need to be a part of our edge.

    Thanks for posting this lovely setup!

    Jason

    Reply
    • Johnathon Fox says

      10/07/2014 at 1:24 AM

      Heya Jason,

      it is very important that as price action traders we are marking our levels on the daily charts and then when moving down to the intraday charts whether it be the 8hr or 15 minute charts we are “reading” the price action and not just looking for patterns i,e pin bars or EB’s etc.

      After marking our daily level and then moving to the smaller time frame we need to take note of what the price action is doing and what the price action story is saying, not simply look for a trigger. For example; we need to see if price is rejecting the key level and making a strong move away as this clearly was.

      Just lastly; whilst we always want to use round number where we can, we need to make sure we mainly focus on the major VBRN and not let the minor round numbers get in our way of obvious levels. If we look at previous price action here and both where price has paused and respected in the past including the pause before continuing lower just recently there is a clear price flip level that price has both in the past and over the last week respected pretty closely.

      Great post and safe trading,

      Johnathon

      Reply
  2. tony B says

    10/05/2014 at 12:35 AM

    Many trader who trade the daily charts would probably not notice the hr pin bar on the aussie – although it appeared to be rejecting the R levels, most would wait for more confirmation before taking a trade. To enter, you would have to see the pin on Oct 2 then take the trade before the start of the Oct 3 trading day. As one can see, by the close of Oct 3rd the trade was over and price went to support for daily levels
    my two cents
    T

    Reply
    • Johnathon Fox says

      10/05/2014 at 12:57 AM

      Heya Tony,

      Nice post. When price is in a really obvious and strong downtrend and then moves into a major price flip and resistance level, traders should be scanning all their time frames (as we often discuss and post about in here regularly). It is not so much about the time frame, but about the price action and what it is doing and the 1hr chart fired off a clear sign that price was rejecting the resistance and had also made a false break of the 1hr recent resistance. If price moved up to the key level and shown signs of moving and closing above as often happens, then obviously we move on to the next chart where price is getting close to a key daily level.

      Whilst there are never any guaranteed trades no matter how great they look, this was a bread and butter setup with the major daily level and strong price action rejection.

      Johnathon

      Reply

Leave a Reply Cancel reply

Your email address will not be published. Required fields are marked *

Primary Sidebar

Forex School Online

High Probability Price Action Trading

How to make, manage and take profit from trades in the markets

Start Learning (It's Free!)

Turn Your Trades into Winners!

The Price action course is the in-depth advanced training on assessing, making and managing high probability price action trades.

Sign up for Free!

Recommended Broker

  • Broker
  • Min Deposit
  • Benefits
  • Score
  • Visit Broker

$200

T&Cs Apply
  • The Lowest Trading Costs
  • 50% Welcome Bonus
  • Award-winning 24 Hour Support
5
Trade Now FreeBets Reviews
Reviews

Footer

Get Our FREE Course, Bonus Strategies & Indicators!
X
Join Us Now!

Your capital is at risk.

X

CORNERSTONE LESSONS

Forex Trading for Beginners

Price Action Trading

How to Trade Forex

Technical Analysis

Forex Charts

Forex Trading Strategies

Money Management 

Compare Brokers

Best Forex Brokers

Forex Demo Accounts

Best Forex Trading Platforms

Forex Apps

Swap Fee Accounts

MT4 Brokers

CATEGORIES

Forex Videos

Trading Lessons

Weekly Trade Ideas

Start Here Guide

ForexSchoolOnline.com helps individual traders learn how to trade the Forex market

WARNING: The content on this site should not be considered investment advice and we are not authorised to provide investment advice. Nothing on this website is an endorsement or recommendation of a particular trading strategy or investment decision. The information on this website is general in nature so you must consider the information in light of your objectives, financial situation and needs.

Investing is speculative. When investing your capital is at risk. This site is not intended for use in jurisdictions in which the trading or investments described are prohibited and should only be used by such persons and in such ways as are legally permitted. Your investment may not qualify for investor protection in your country or state of residence, so please conduct your own due diligence or obtain advice where necessary. This website is free for you to use but we may receive a commission from the companies we feature on this site.

We Introduce people to the world of currency trading. and provide educational content to help them learn how to become profitable traders. we're also a community of traders that support each other on our daily trading journey

Forexschoolonline.com is not a financial advisor. Do your research before investing your funds in any financial asset or presented product or event. We are not responsible for your investing results.

Copyright © Forex School Online Sitemap  - Privacy Policy - Disclaimers & Terms of Use - CONTACT US