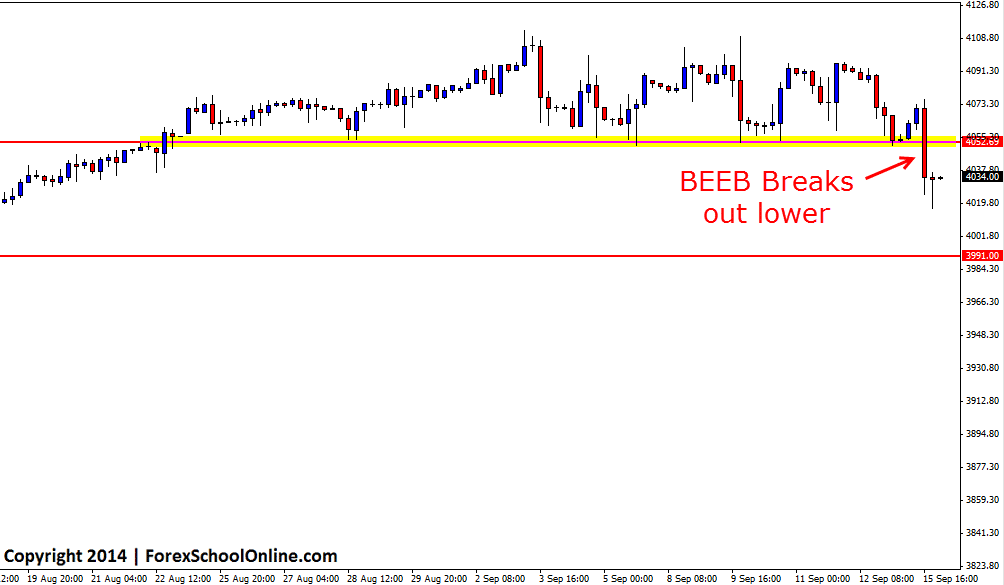
Price has crashed lower and through an important level on the price action chart of the US Tech 100 Index. Price on the higher time frames such as the daily chart had been moving in a strong trend higher of late, but price moved into a consolidation and winding up period with price now breaking out of that consolidation with a strong move lower and through the breakout support area.
As the 4 hour chart shows below; this breakout of the consolidation has been fast and aggressive and price has broken out lower with a Bearish Engulfing Bar (BEEB). This breakout could potentially see price make a move lower with the near term support level coming in around the 3991 area.
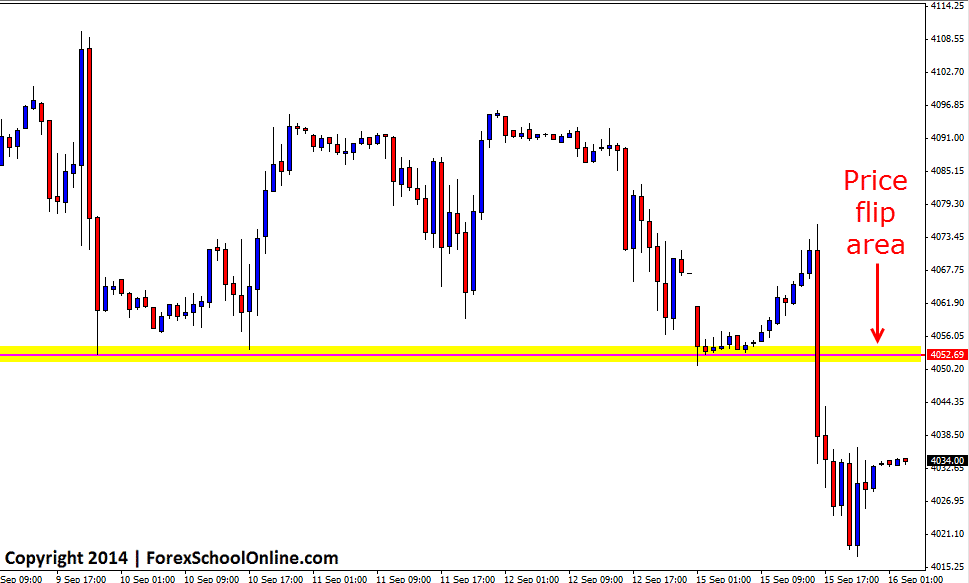
Traders looking to get into this short term move lower could target the old breakout support area as a new price flip and potential new resistance area. As the 1 hour chart shows below; this old support/new resistance could look to act as a high probability area to look for short trades should price rotate back higher. Taking a short trade at this new resistance level would be taking a short trade at the First Test Resistance (FTR) and as I discuss in the recent trading tutorial for traders Taking High Probability Setups From First Test Resistance/Support the first test areas can be super areas to look for trades because the supply and demand will quite often be at it’s strongest.
Traders would need to see price form a high probability bearish price action trigger signal at this key resistance for any potential short trades to be taken such as the trigger signals taught in the Forex School Online Price Action Courses.
– If you need a broker with the correct New York close 5 day charts that offer both Forex pairs and other markets such as the major indices like that are being covered in this post today, then check out the post Recommended Charts and Forex Broker for Price Action Traders
US Tech 100 4 Hour Chart

US Tech 100 1 Hour Chart


Leave a Reply