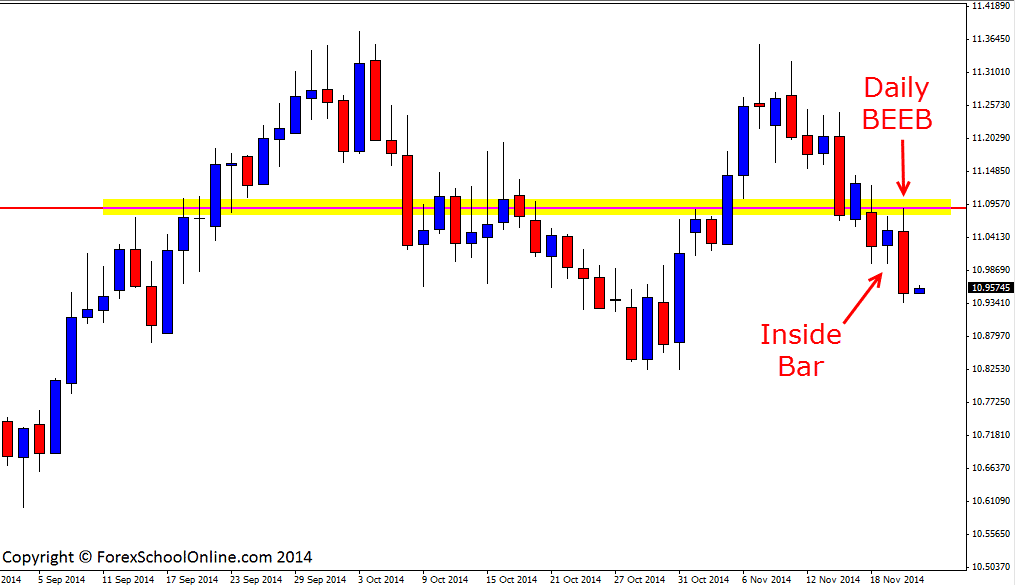
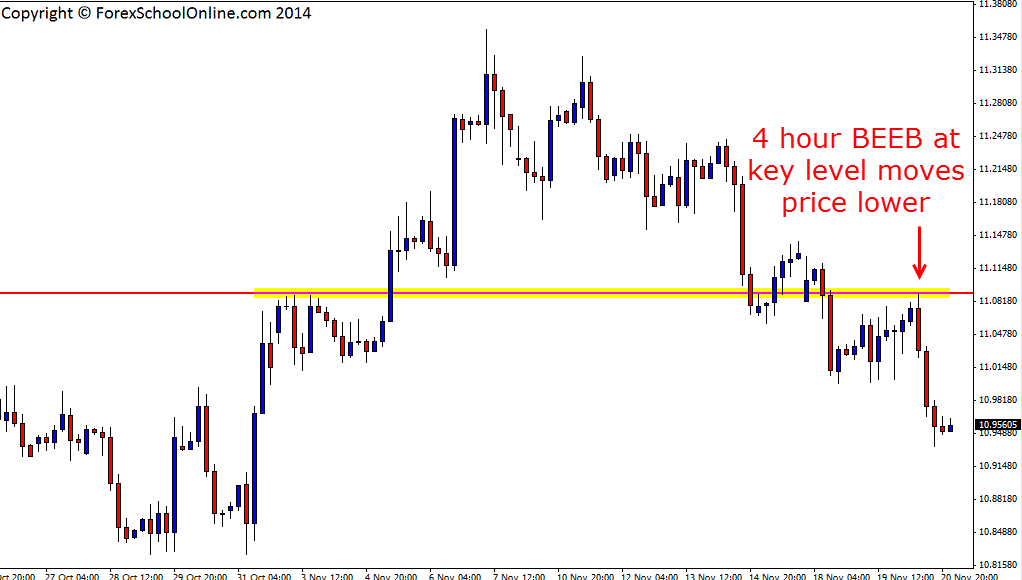
The USDZAR (US Dollar V South African Rand) has fired off price action Bearish Engulfing Bars (BEEB) on both the 4 hour and daily charts. As the 4 hour chart shows below; price had made a sharp retrace back higher and into the resistance before price fired off the 4 hour bearish engulfing bar. Price confirming and falling lower from the 4 hour charts bearish engulfing bar has now formed the daily charts bearish engulfing bar with price on the daily chart moving lower and away from the key daily resistance to close well below the previous sessions inside bar.
This BEEB is inline with the recent strong down-leg that price is making after price made a double top. At the second rejection of this double top price fired off a bearish pin bar reversal and after this pin bar was confirmed price sold off heavily. If price can break the low of this BEEB and continue the strong momentum lower, it may be able to gain momentum and move into the major support level I discuss in the 30th October Daily Forex Market Commentary on the USDZAR
In the previous 30th October commentary I discuss a 2 bar reversal that has since seen price rocket higher, but more importantly I also discuss trading decisions around these more exotic Forex pairs such as the USDZAR. In that post I comment on the different Forex pairs I personally trade, what traders need to look for when they are assessing a market and also how many pips is too many when it comes to the spread. I highly recommend traders read it. You can find it here;
Daily Forex Market Commentary Recap Post
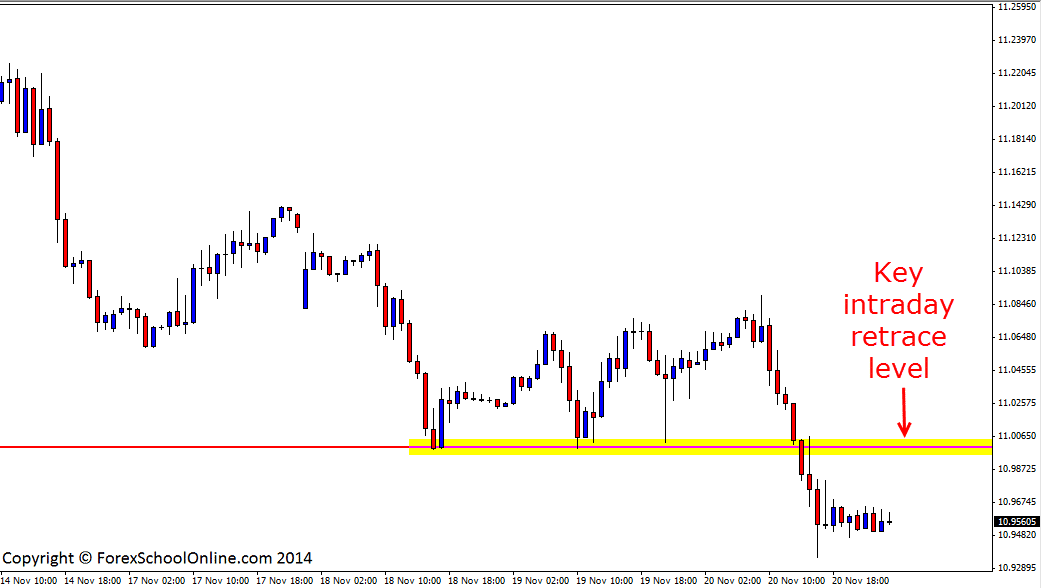
If price moves back higher it could present a solid opportunity to look for short trades on the intraday charts such as the 1 hour chart or potentially even smaller. As the 1 hour chart shows below; there is a key resistance sitting overhead that could be a potential solid price flip area should price rotate back higher.
USDZAR Daily Chart

USDZAR 4 Hour Chart

USDZAR 1 Hour Chart


Leave a Reply