Price on two separate stock indices markets formed two bar reversals that I am going to recap and look at what we can learn from them in today’s Forex Trade Setups Commentary.
FTSE 100 Daily
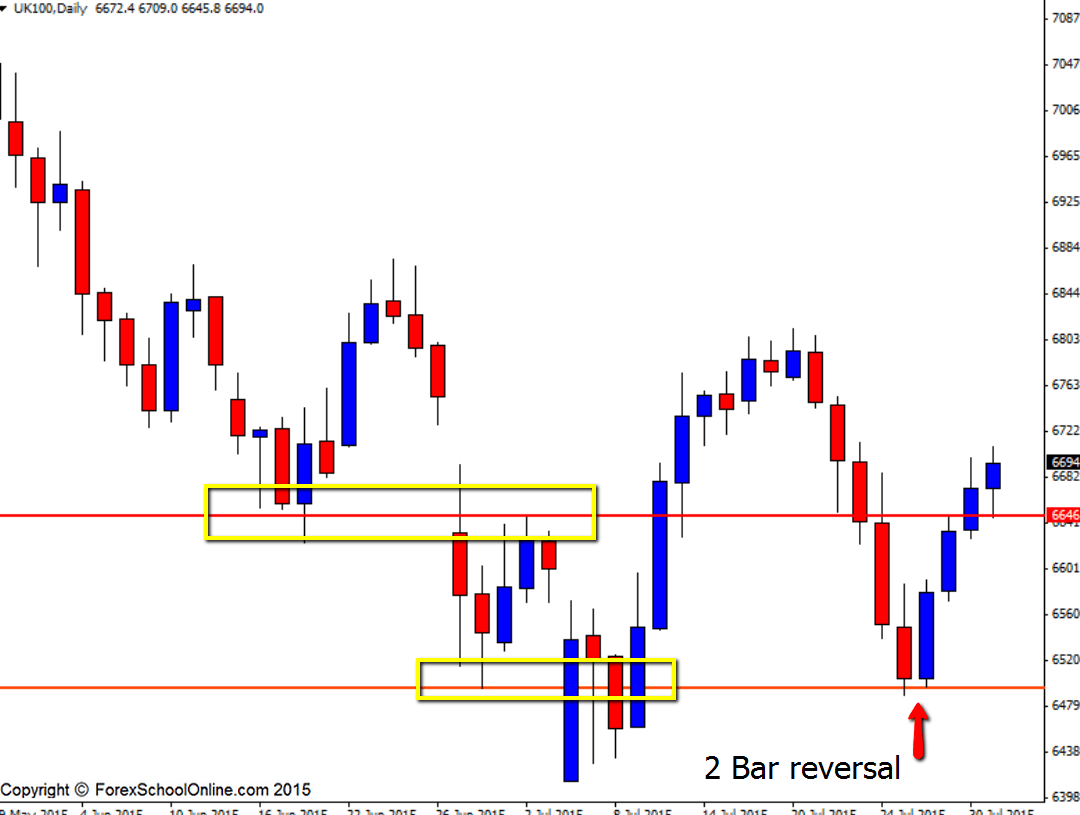
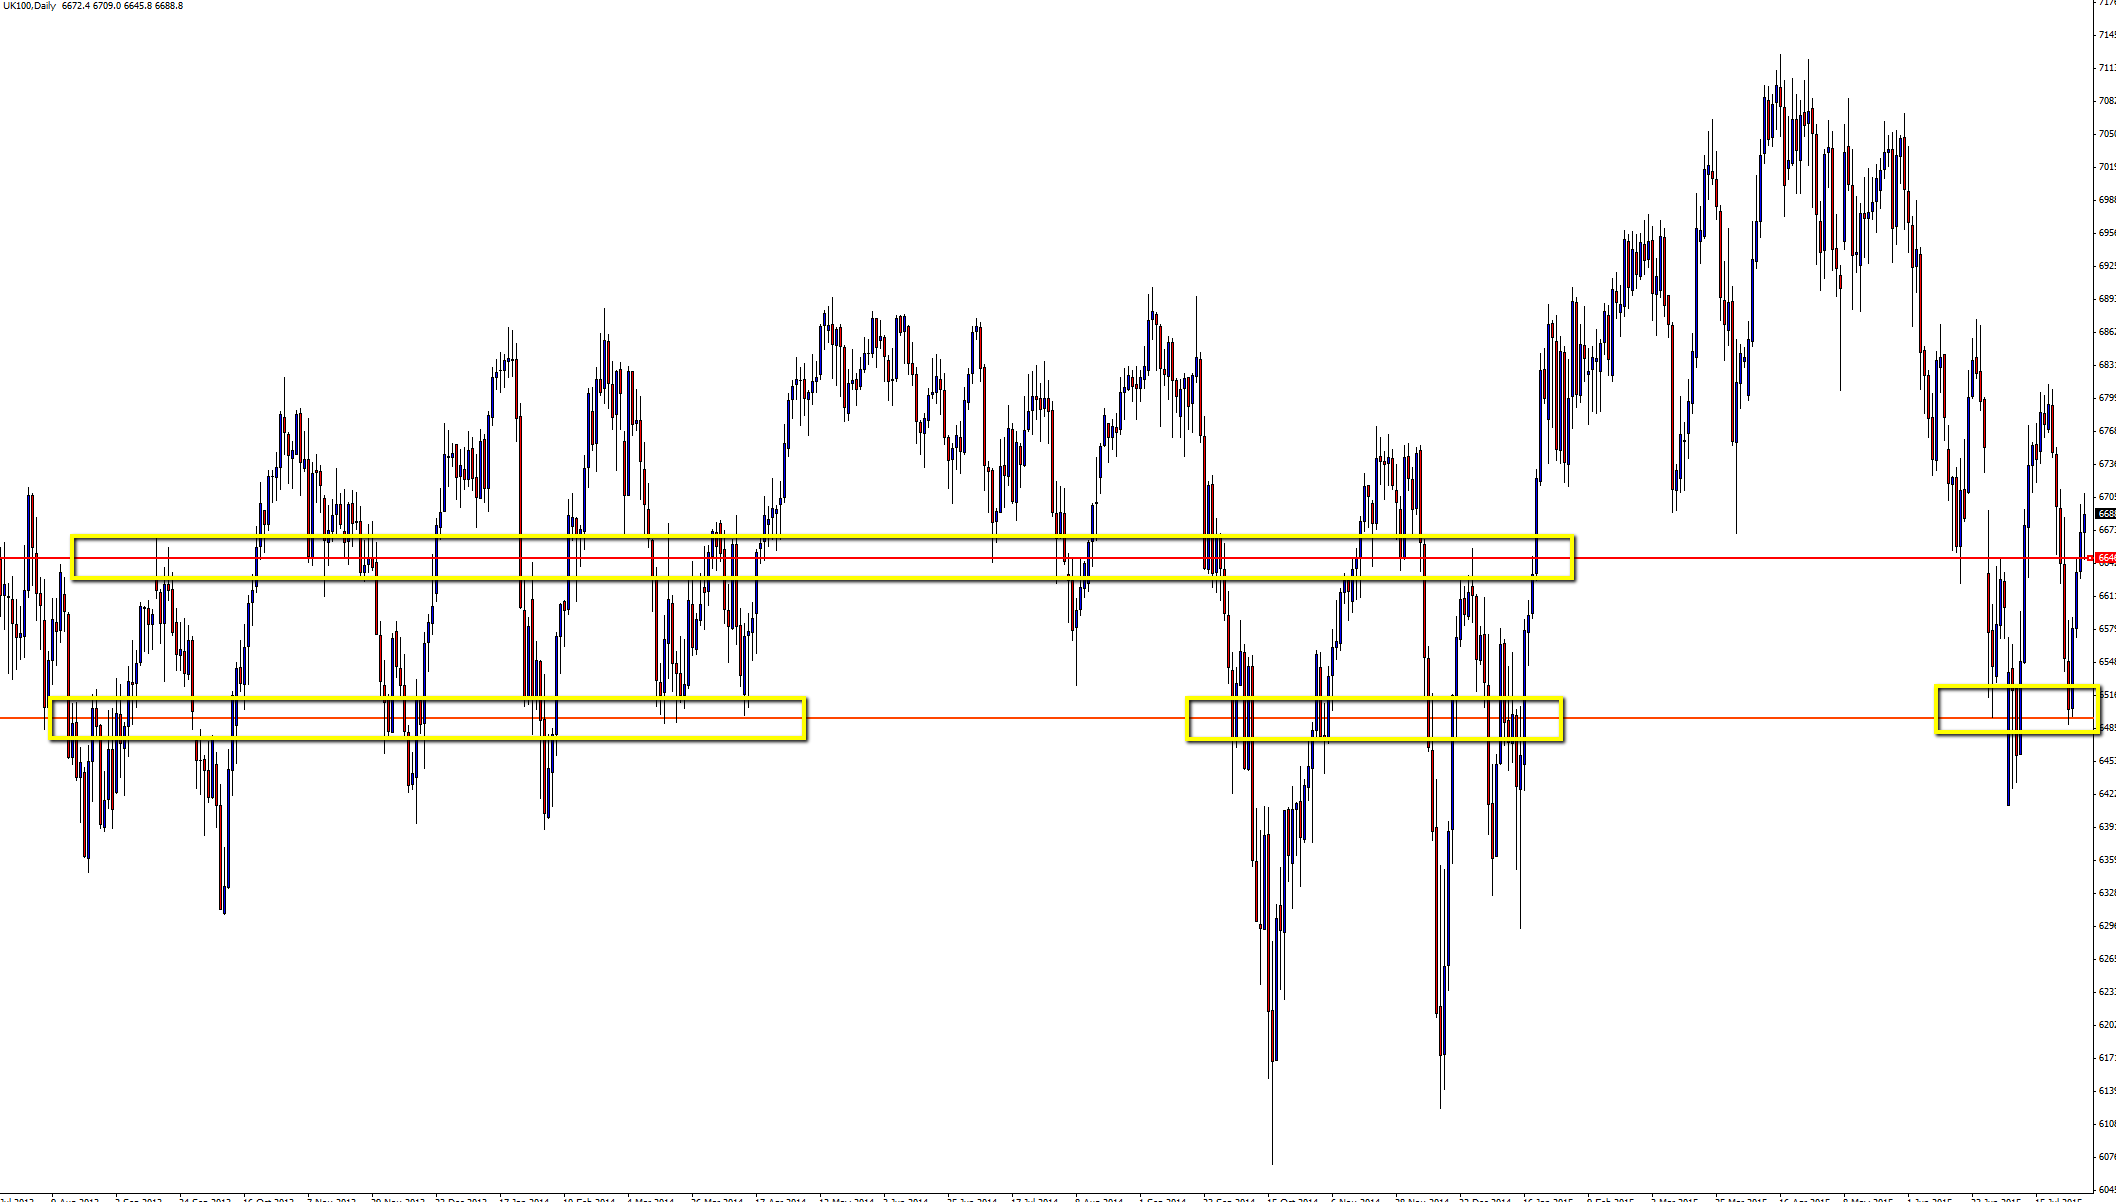
The FTSE or UK100 formed a large 2 bar reversal that I posted up live as it was forming on the 28th July 2015 | FTSE Rejecting Major Price Action Demand Area on Daily Chart. This large 2 bar was down rejecting the major daily support level that as the zoomed out daily chart shows below; has been a majorly important level for some time now in this market.
After posting about this market in this blog; price confirmed the 2 bar by breaking the high and moving higher. Although this market is in a range and is very choppy, there was clear space for price to trade into higher and after price broke higher it made a strong move and went straight into the resistance above around the 6646.90 area.
Price has now broken this level and is still moving higher on the back of the strong 2 bar reversal. If price continues to move higher, the next major resistance comes in around the 6751.85 level.
Daily Chart

Daily Chart – Zoomed Out

Spain 35 Daily Chart
Another 2 bar reversal I posted this week in the Forex Trade Setups blog was on the SPA35 or the Spain 35 and you can see the post with all the details at False Break 2 Bar Reversal Fired Off on Spain 35 Index Daily Chart | 29th Jul 15
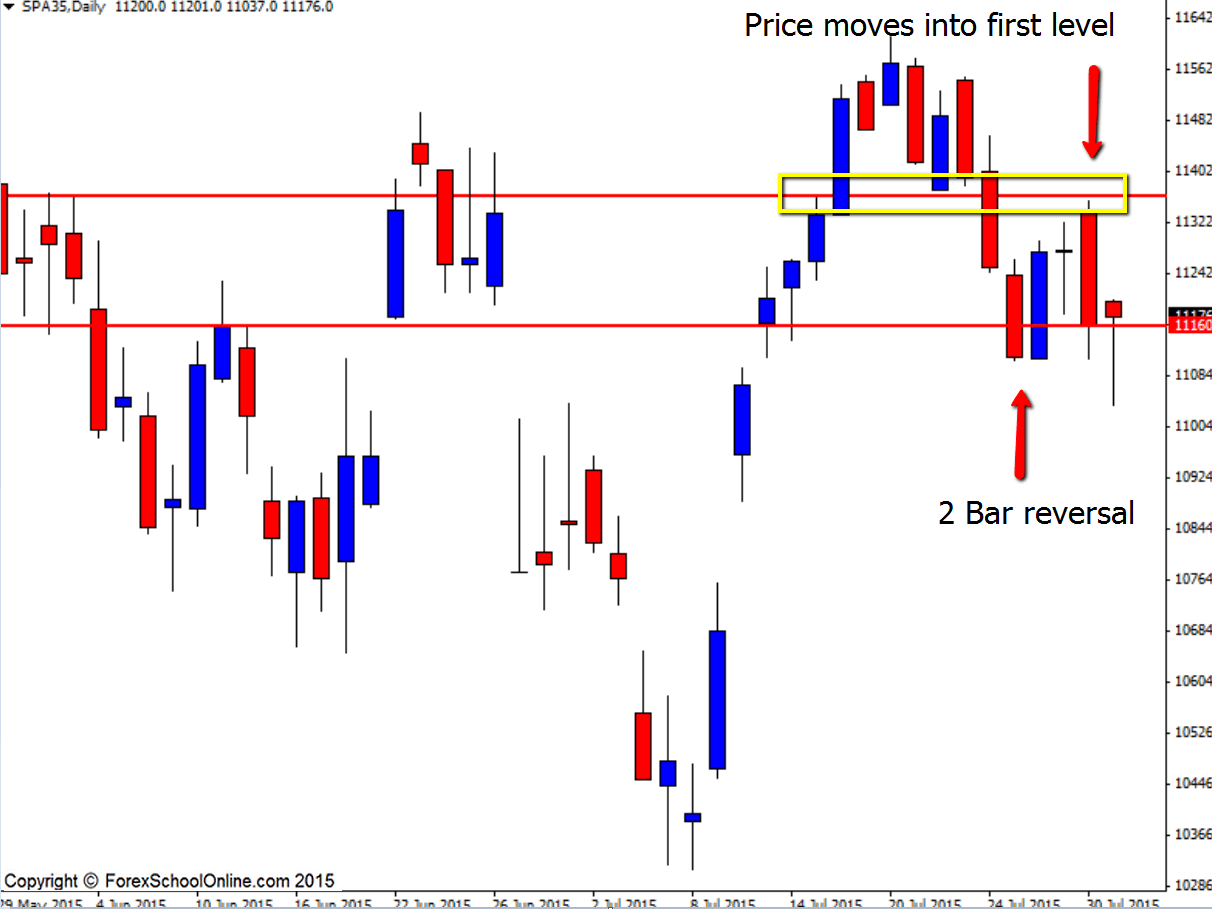
This market was even choppier and sideways than the FTSE, but the daily 2 bar reversal was down at the low and rejecting a major support level and notably it was also making a false break. The nose of the 2 bar reversal moved below the support level for the first half of the setup before then snapping back higher to create a false break and getting a lot of the market moving the wrong way.
After completing the 2 bar reversal, price did confirm the setup and price did break higher. The major issue with markets such as these when they are not strongly trending is that there is not normally much space and price tends to respect the minor levels. This is something you really need to keep in mind when trading within ranging and sideways trading markets.
Price made a move higher and straight into the near term resistance level that we spoke about and highlighted that would be the area to watch out for in the post on Thursday. From here price is back down at the low and re-testing the major daily support level, so expect more potential ranging and sideways trading.
Daily Chart


Leave a Reply