Weekly Price Action Trade Ideas – 3rd to 8th March 2019
Markets Discussed in This Weeks Trade Ideas: AUDUSD, EURJPY, GOLD and US500
Note: We Use Correct ‘New York Close 5 Day Charts’ – You can read about why we use these and how to download the correct free charts at Correct Free New York Close Demo Charts
EURJPY Weekly and Daily Charts
Price Action Breaks Major Weekly Level
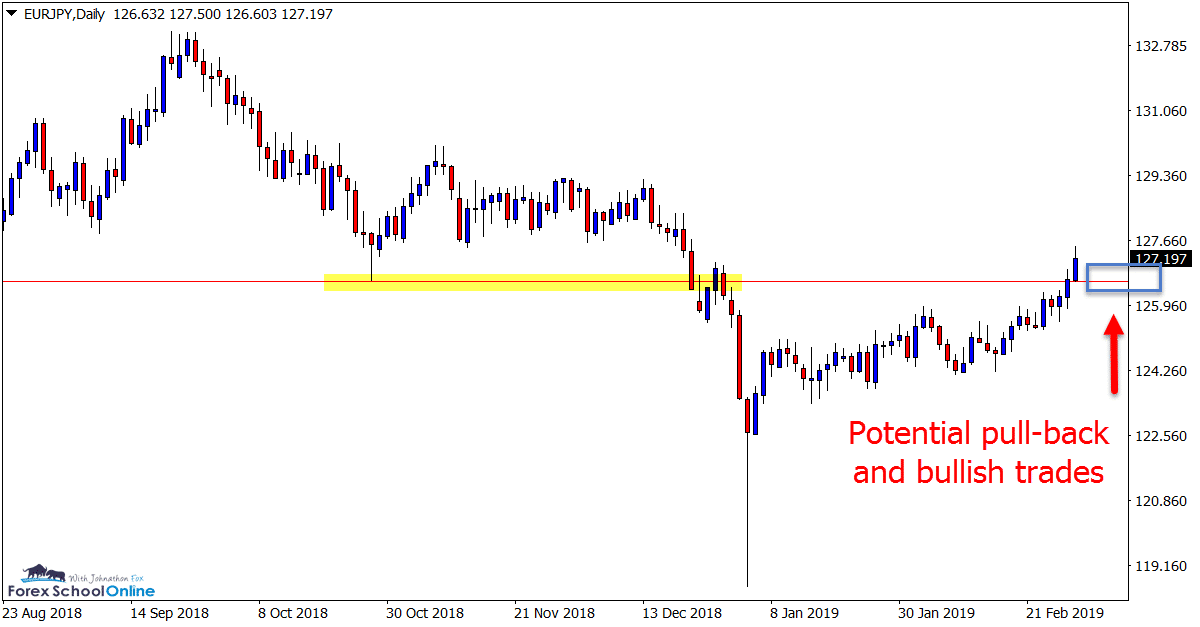
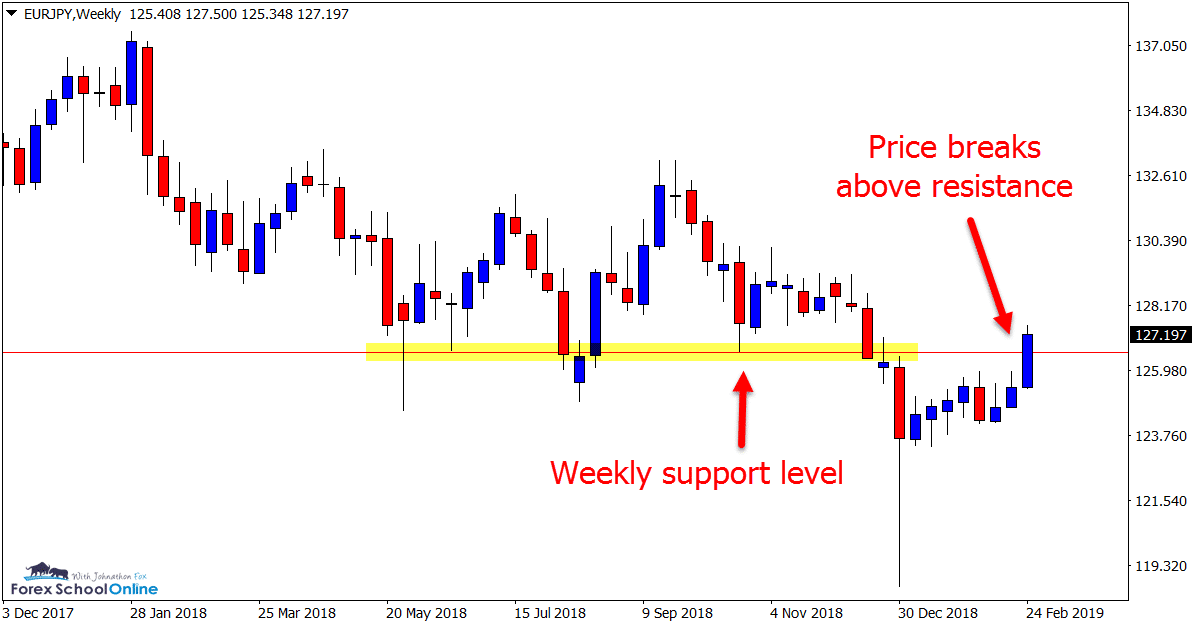
Price action has broken out and through a major daily and weekly level on the EURJPY.
Whilst we don’t often discuss the weekly charts, the weekly time frame on this pair shows this major level and the breakout the clearest.
In our recent trade ideas of 25th January trade ideas we were looking for a potential quick move into the 125.00 and 126.60 area. As you can see from the charts below; price has now broken through this level with strong momentum.
Any quick pull-backs into this old resistance and new support could provide for potential high probability long trade setups.
Weekly Chart
Daily Chart
AUDUSD Daily Chart
Price Moving Into Crossroads
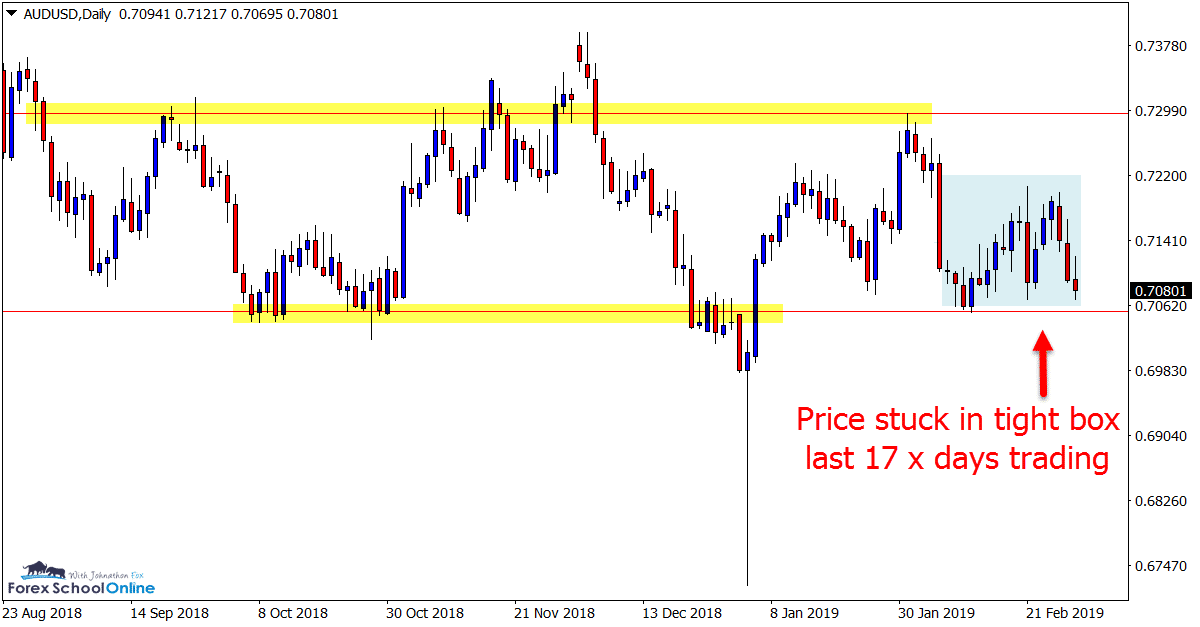
Price action on the daily chart of the AUDUSD has been trading in a tight box for the last 17 sessions.
Whilst price is trading within an overall sideways ranging pattern, price looks to be coming to a crossroads and we may finally see where it wants to move.
Before moving into this sideways consolidation pattern, price had been in a heavy down-trend since the start of 2018. If price can now finally breakout of the range and tight box price has been in, then we could see a fast break lower with potential breakout trades opening up.
Daily Chart
GOLD Daily & 4 Hour Charts
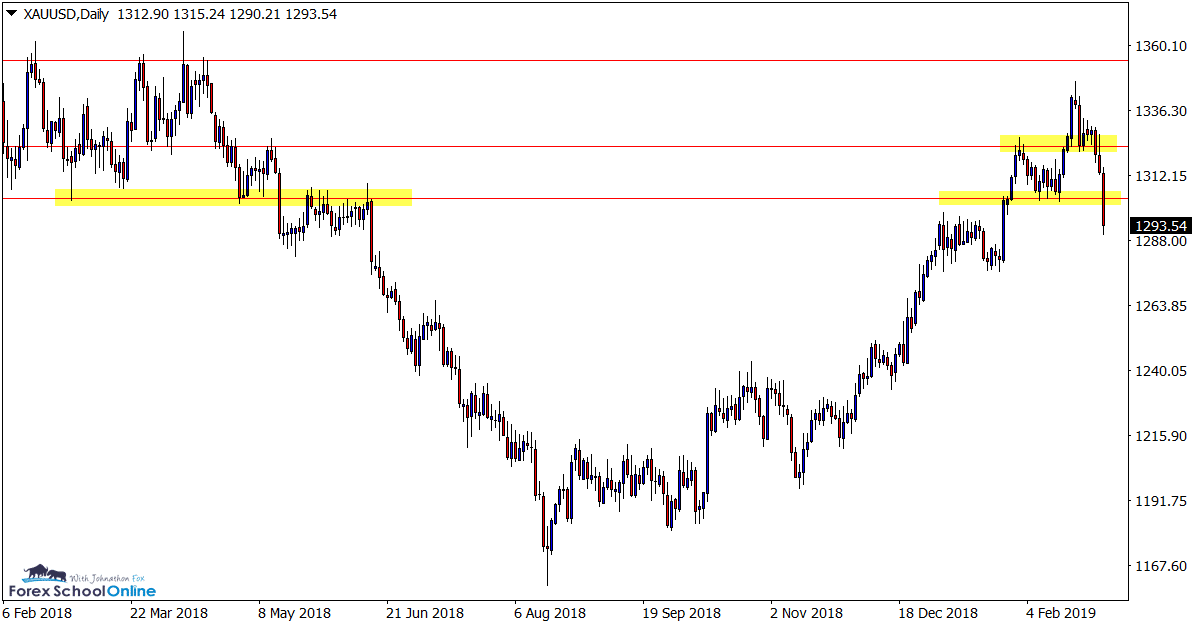
Price Slams Through Daily Support Level
In last week’s commentary we posted about this market, looking to see if price would continue higher after a small hesitation.
Whilst price tested the near-term support level, it soon slammed lower and in the process broke through two major daily support levels.
As you can see on the intraday 4 hour chart below; this move was very aggressive with price forming two large Bearish Engulfing Bars; BEEB’s.
This breakout support level will now be super interesting to watch over the coming sessions to see if price will make a quick move back higher and to re-test as a new resistance.
Daily Chart
4 Hour Chart

US500 Daily Chart
Price Testing Major Daily Levels
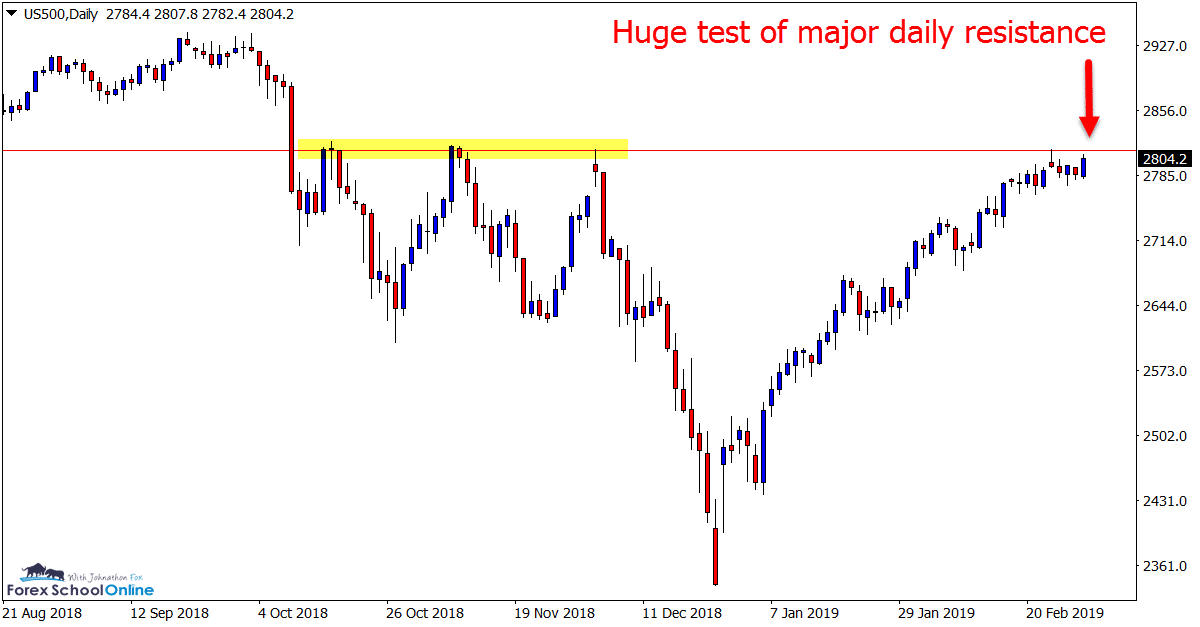
On the 22nd Feb we posted about watching the major daily resistance level in this market as it looked a clear daily level for price to move into and make a fresh re-test.
The first test we saw was small with the pull-back lower a minor move. Price is now looking to make a fresh attempt at breaking higher.
A break higher in the next few sessions and we could see price continue this strong and aggressive move higher that price has been moving in.
Daily Chart
Charts in Focus Note: All views, discussions and posts in the ‘charts in focus’ are the view of Forex School Online and are not recommendations or trading advice. All posts are general in nature and are not advice to buy or sell.
Please leave questions or comments in the comments section below;


Nice detailed analysis. Thank you Johnathon.
Thanks Thambirajah 👍
How to join with you and learn about price action n how much fee for u to mentroring me for forex
Hi Engcai,
we have a free course you can start right now here; https://www.forexschoolonline.com//forex-school-beginner-course
This free course section also has a ton of free bonus downloads to help you out.
Safe trading,
Johnathon