Weekly Price Action Trade Ideas – 3rd to 7th August 2020
Markets Discussed in This Week’s Trade Ideas: GBPUSD, USDCHF, GBPAUD and AUDCAD.
Note: We Use Correct ‘New York Close 5 Day Charts’ – You can read about why we use these and how to download the correct free charts at Correct Free New York Close Demo Charts
GBPUSD Daily Chart
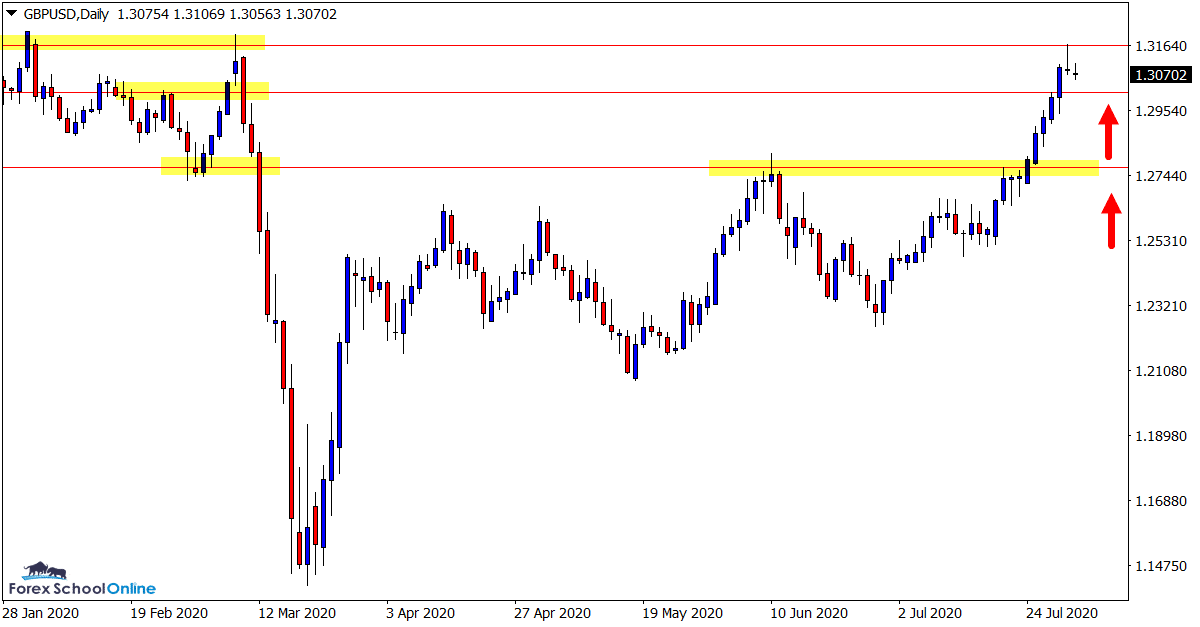
Momentum Continues Higher
In last week’s trade idea’s we were watching this pair closely for a continuation of the breakout and for new momentum higher.
Price has since formed a strong leg higher and the old resistance has held up as a new support level.
On the daily chart shown below we can see price has formed a small bearish pin bar. This could see price rotate lower. If this is the case it could provide an opportunity to look for potential long trades with price pulling back into support.
Daily Chart

USDCHF Daily Chart
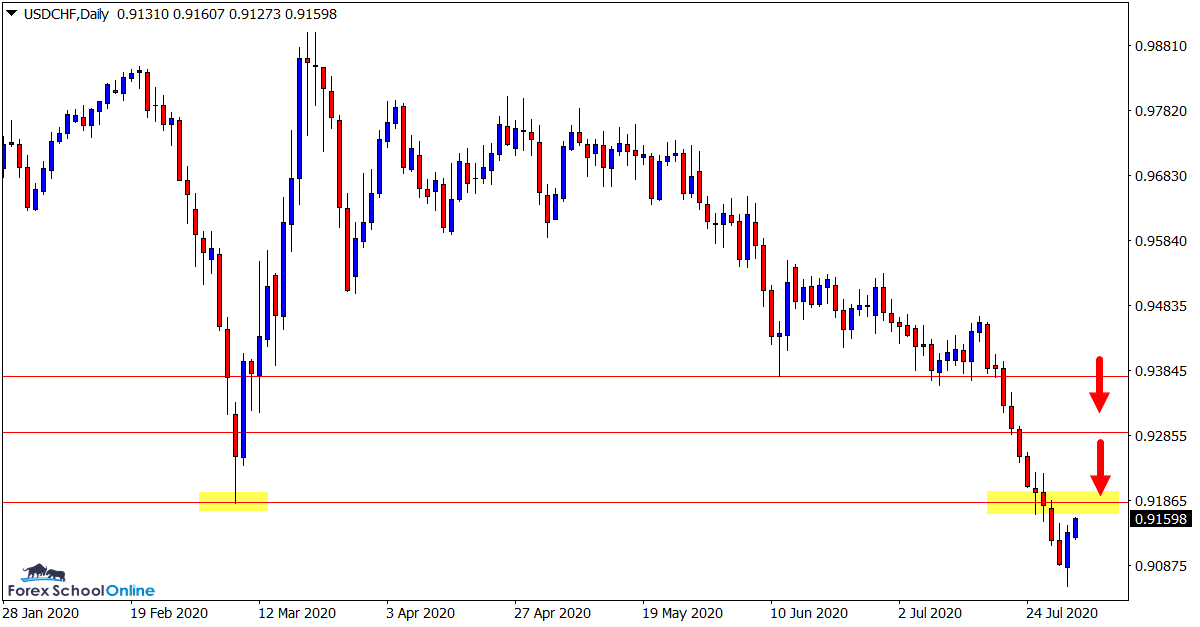
Will Support Flip to Resistance?
After making a huge move lower in the last two weeks of trading, price has now paused and formed a bullish 2 bar reversal on the daily chart.
If price can rotate higher from this bullish 2 bar it could present potential short trading opportunities.
There is a very close near term resistance level and a further resistance level that could prove key levels that would also be inline with the recent strong momentum lower.
Daily Chart

GBPAUD Daily Chart
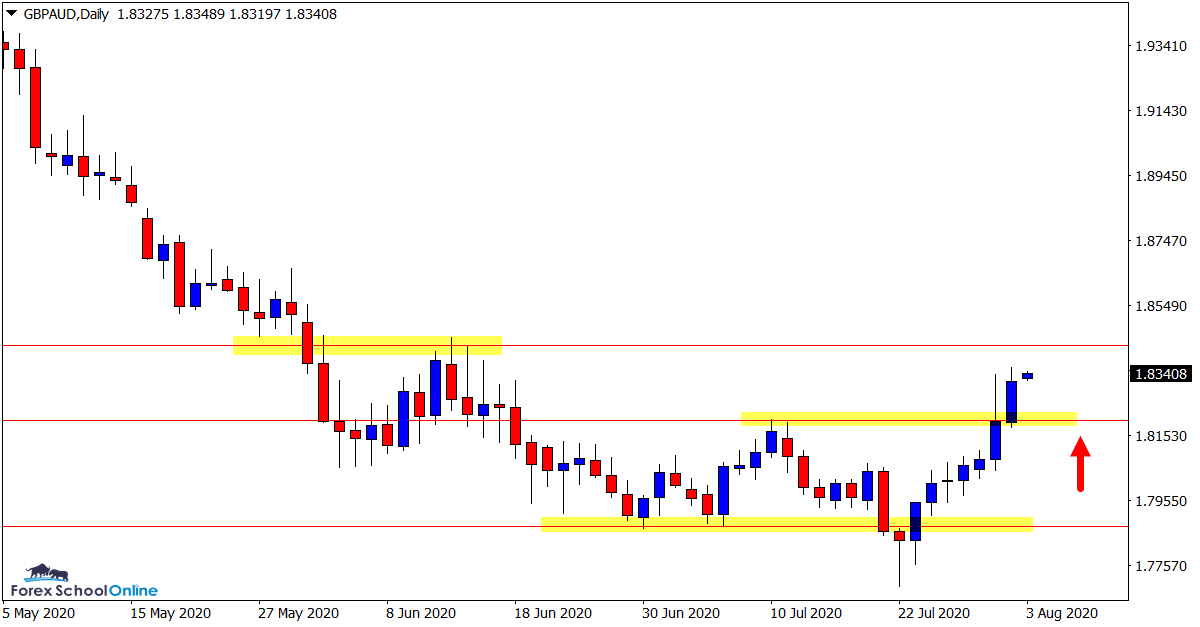
Price Moving With Breakout
For most of 2020 this pair has been getting sold off lower. However; in recent times price has made a rebound as the daily chart shows below.
After forming a bottom pattern price has now broken out of the daily resistance level.
If this resistance can hold as a new price flip support level we could see price go on and create a more substantial leg higher and a further turn around.
For this to occur we would need to see the close overhead resistance successfully taken out.
Daily Chart

AUDCAD Daily Chart
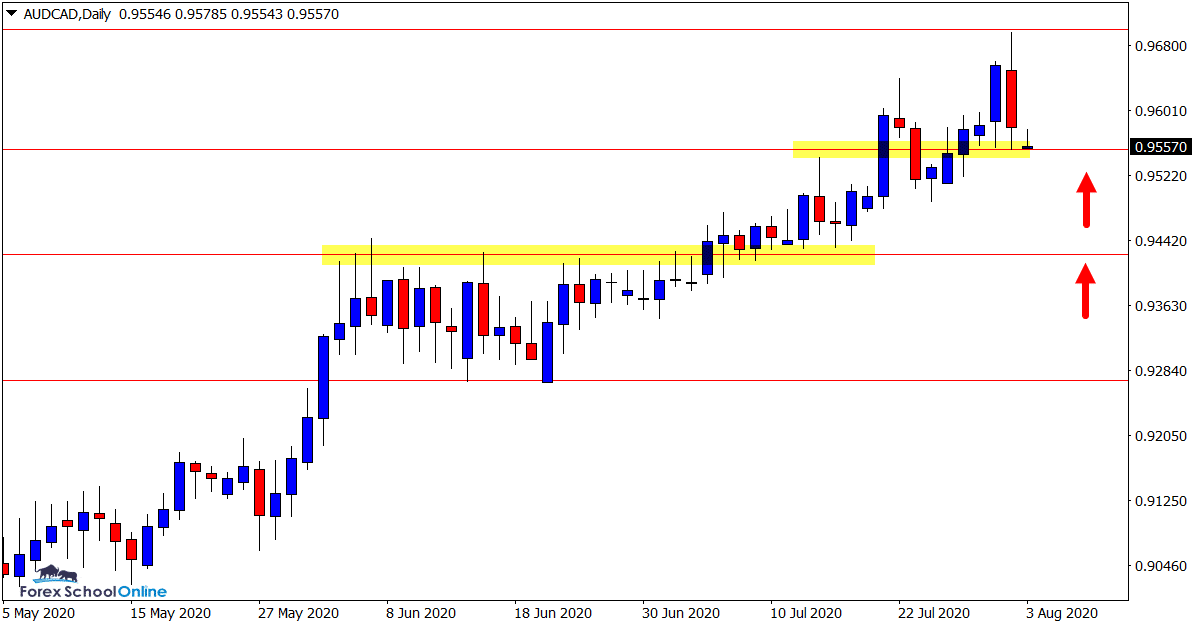
Watching for Pullback from Bearish Engulfing bar
This is a pair we have been looking at a little bit in recent times because of its fairly clear-cut trend higher.
Price has now formed a bearish engulfing bar on the daily chart.
If price can break lower from this engulfing bar we could see it rotate and make a pullback into a support value area.
If this occurs in the coming sessions it could be a solid level to look for new potential long trades with any A+ price action trigger entries.
Daily Chart

Trade Ideas Note: All views, discussions and posts in the ‘charts in focus trade ideas’ are the view of Forex School Online and are not recommendations or trading advice. All posts are general in nature and are not advice to buy or sell.
Note: We Use Correct ‘New York Close 5 Day Charts’ – You can read about why we use these and how to download the correct free charts at Correct Free New York Close Demo Charts
Please leave questions or comments in the comments section below;


Leave a Reply