How do you start your trading week?
Did you start out knowing exactly what trades you were going to be hunting, where you were going to be hunting them, and the markets you were going to be especially watching?
Or, did you follow the pattern of a lot of traders; just plodding along from week to week, session to session, hoping that something will pop-up and you will be good enough to catch it when it does?
Patterns repeat, not just on the charts, but in life. We do the same things, are prone to the same mistakes and what we did last week will tend to roll on and on unless we change it consciously.
How you set up at the start of the week will decide what your trading does for the entire week.
If you are not setting your trading up with the proper price action analysis, laying it out and preparing it, then you are not taking it seriously enough as a business yet.
Why the Best Traders Create a Regular Technical Analysis Summary
The very best traders are set up at the start of the week and have a trading routine they follow every single week.
They have their levels, kill zones, price alerts, entries, plans and anything else they will need ready before that trading week starts. Rather than chasing the price and being behind the rest of week.
In this lesson I am going to show you how you can set up before the start of the trading week so your trading runs a lot more smooth, is a lot more efficient and you know where you should be hunting trades.
What is a Market Summary?
A market summary is what you are going to use to set your trading up at the start of each week to save time, make better trades, and make sure those trades are from the best areas in the market. You will analyse the markets and create specific notes on these markets and Forex pairs.
With this market summary you will start to build a routine that will flow into the rest of your trading and life to help you create better habits.
As I am about to show you; this will also help you cut down on literally hours of trade hunting time each week.
What Are You Doing Now?
Chances are you float around the charts from setup to setup with no concrete plans.
I am not sure how long you have read or watched my lessons, but I like to have a set plan and logical reason for what I am doing.
Floating between charts is fine, but I prefer to have an exact reason for being there and knowing what I am looking for.
I also do not have hours and hours on end to trawl charts looking for setups. I like looking for intraday setups during the US/UK sessions, but I don’t want to waste my time hunting trades when the market is producing rubbish and there is nothing to hunt.
Would a hunter put all his camo gear on, grab all his ammo, fill his truck with petrol, drive 4 hours and then go and stand in an open paddock where he KNOWS there is absolutely nothing to hunt?
Ummmm… anyone?
So why would I, or you trawl through all your different time frame charts, looking at ALL the price action, if we could know nothing is there to trade?
If we are pre-prepared, it is possible to know there will not be a trade setup on the smaller time frames like the 1 hour, or the 4 hour charts and we will not have to look at them all individually.
And this is why; when you start getting set up correctly at the start of the week with a summary, and getting into a proper routine each and every week it can flow into your whole trading and have huge results.
I will go through the exact steps in a moment on how to setup your own summary, but the reason I am not wasting time I don’t need to on the charts and also don’t miss setups is because I know where my major levels are on the daily charts.
I know when price moves into these levels I begin hunting for A+ triggers to enter trades.
If price is not at these levels, I am not getting all my hunting gear on and standing out in a paddock wasting my time for nothing. I am waiting like a trading sniper, and then making the shot count.
I am also not looking at every single smaller time frame. I don’t go to a smaller time frame until price hits an important daily level.
How to Create Your Own Weekly Technical Analysis Market Summary?
I use Google docs, but there are a ton of applications you can use, like Evernote or even word.
I like Google docs because I can access them anywhere, they are constantly saving without me having to do anything, and I can also access offline, download, share.
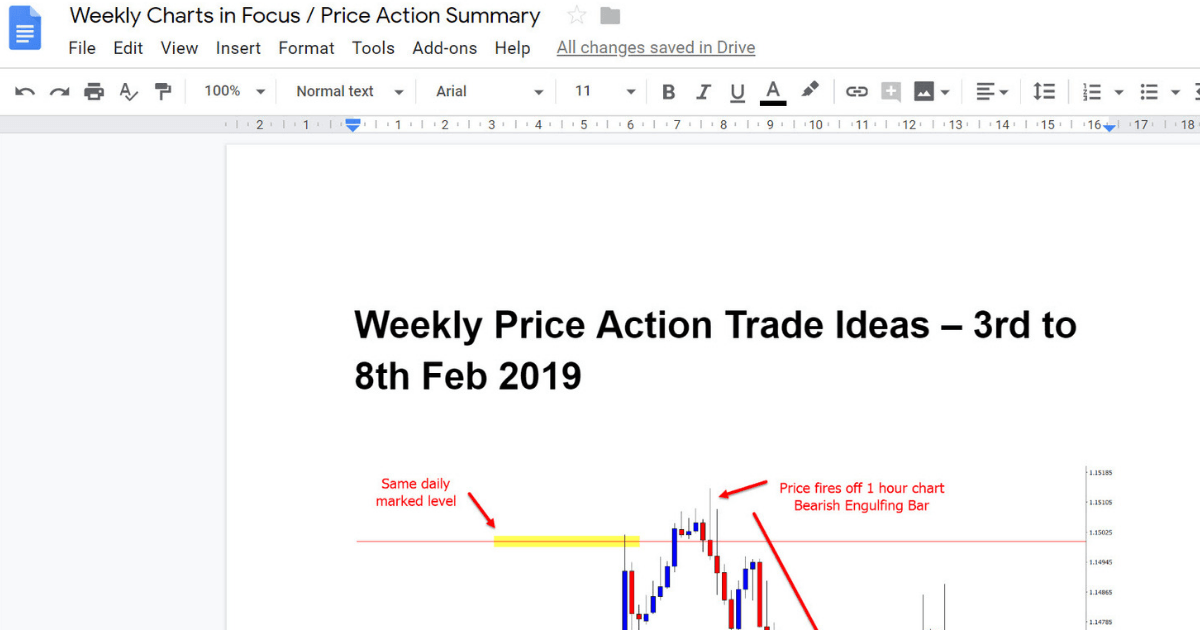
STEP #1: Go Through Charts & Markets: Mark Major Levels & ‘Hot Zones’
This is going to make or break your summary.
How you mark your charts is crucial to both setting up at the start of the week and your overall trading.
If you have not read it yet I highly recommend reading the Ultimate Guide to Price Action Support & Resistance.
What exactly are you looking for as you go through before the markets open each week?
And what should you be marking?
The first thing is; don’t fall for the trap of marking a bagillion levels everywhere. And don’t even fall for the trap of marking ONE level, if the chart does not warrant it!
I know it is a crazy and an out there sort of concept, but have a look at the chart below; it is a shambles with price going sideways and moving through a real tricky period.
I can say with absolute confidence; there is no way I am going to make a trade in that market in the next five days. In my next summary I will reassess as price may have broken out or started to trade more freely, but at this point I do not want to take part and risk money in that market.
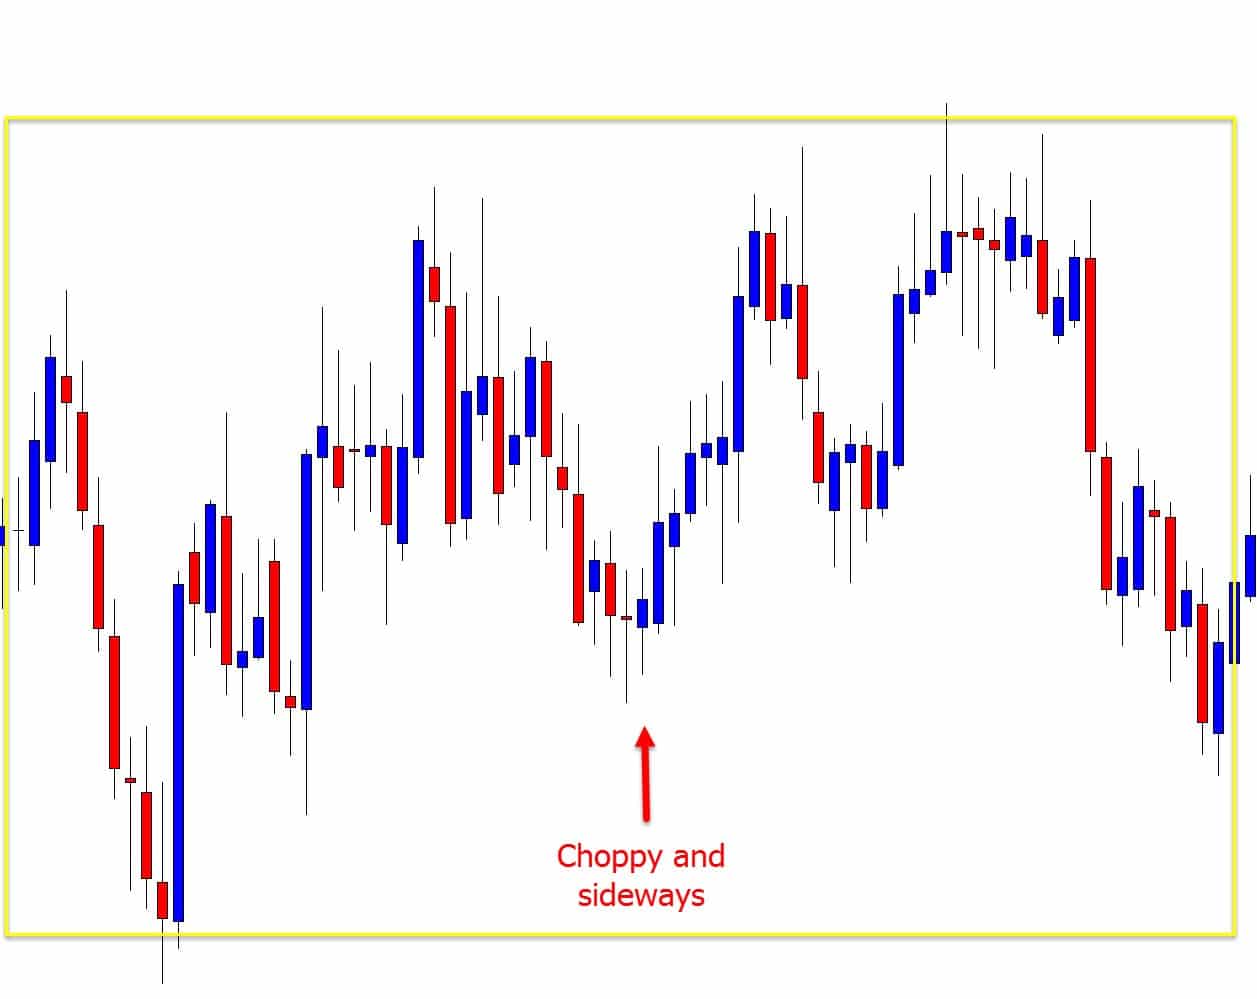
The levels in the chart above are unclear, and marking levels is a waste of my time. I assess it and move to the next market where I am better of spending extra time. Remember; fast & efficient = not standing in the open waiting for no reason.
This is also why we cherry pick the best trades from many markets, not over-trade from a handful.
Forex pairs and other markets move in phases. They are ranging and in sideways movements FAR more often than trending and they can get caught in ranges for months.
If you only watch a few pairs, you can either be caught over-trading rubbish, picking from very few trade setups, or waiting a long time for them to form.
Read how we pick the best trades and markets at;
Cherry Pick The Best Markets & Pairs
As discussed in the Ultimate Price Action Guide; the idea of major daily support or resistance levels should not be random support or resistance levels. Note this and burn it to memory;
You want to mark your MAJOR daily support and resistance levels at the zones you WANT to enter trades from.
Minor or just any old random levels can be left. Once you are actually in a trade, then you can add in the other support/resistance, profit targets, stops etc. First you need the major daily hunting levels.
NOTE: These can be many different types of levels, such as; ranging, trend pullback, major swing points etc, but the idea is the same; if price moves back or into this level during the week, you would want to make a trade at it.
Lastly; you want a maximum of two levels on your chart. 1 x level above and 1 x level below price.
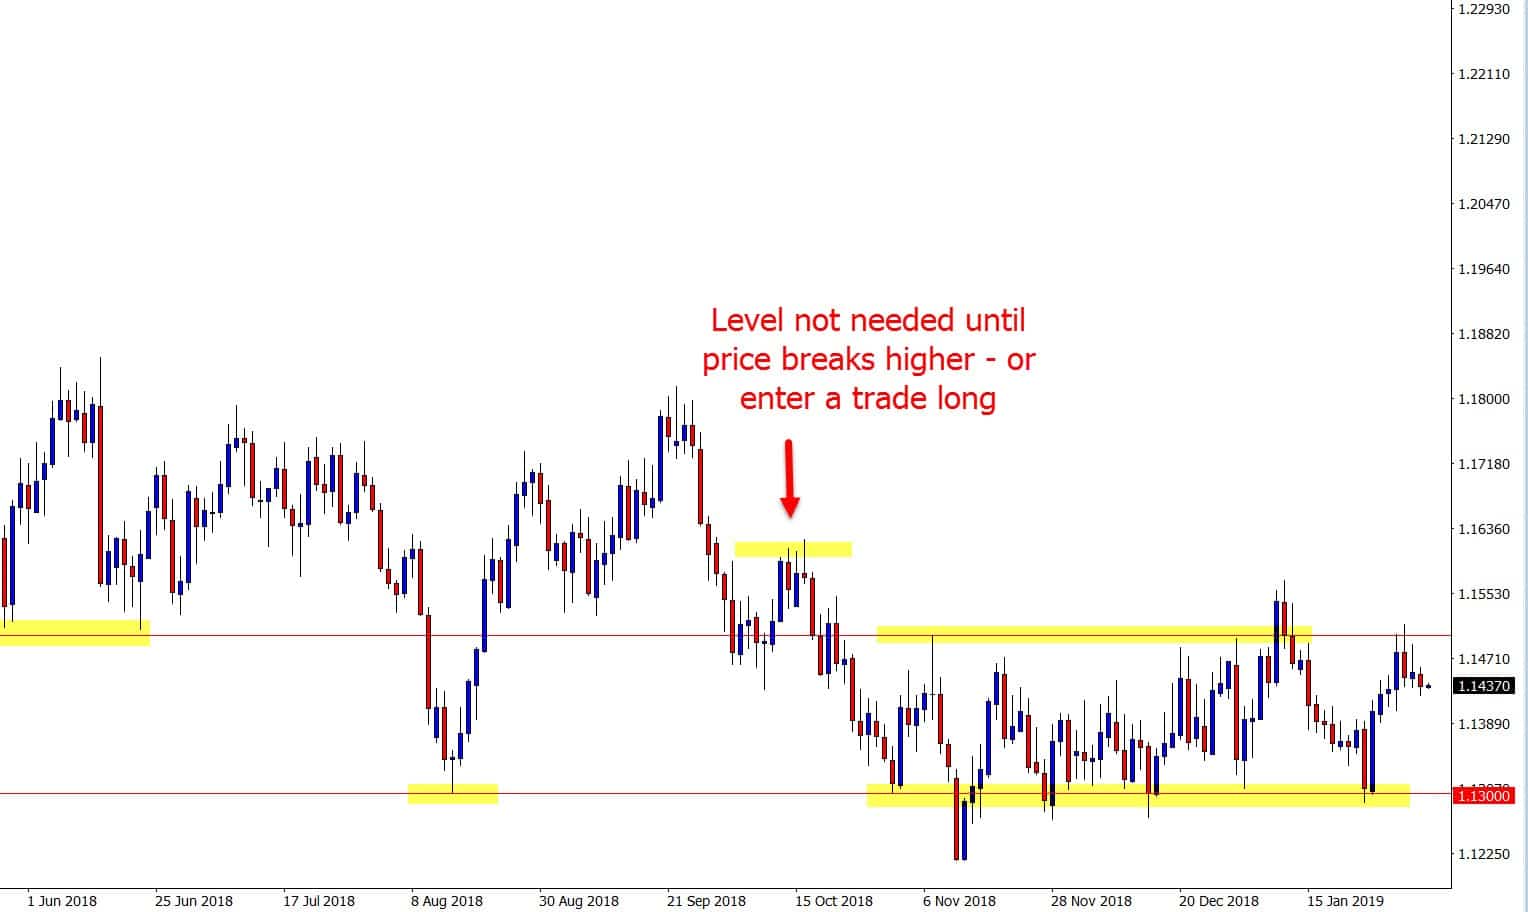
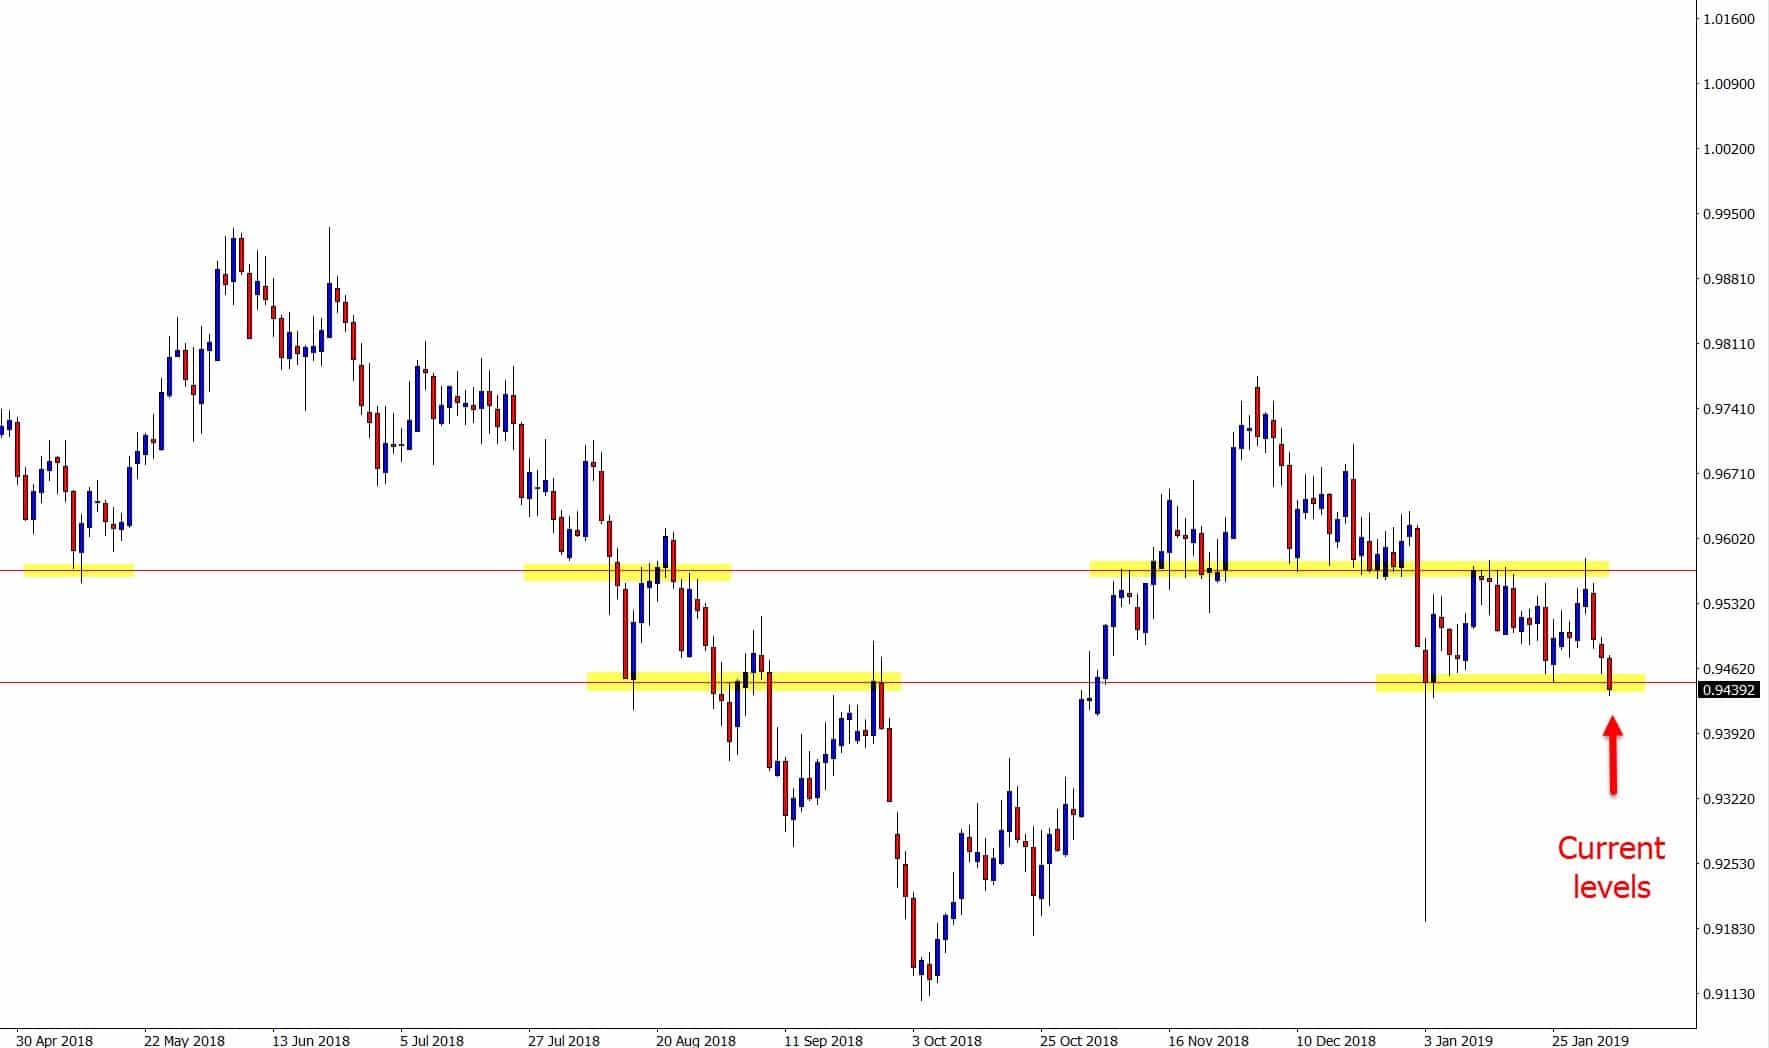
More times than not, you will only have one level on your chart because that is the ONE spot you want to hunt a trade from.
Other times you will not have any levels, because as we went through above there will not be any levels that you are interested in making trades from.
STEP #2: Open Google Docs: Pick 5 x Pairs / Markets for the Week to Analyse More Closely
This is the easy part and like with everything; you will get out what you put in. You are going to find that your connection with the market will quickly grow when completing this.
What do I mean your connection? Have you ever taken a break from the markets and when you come back everything feels a little bit off and it takes time to get back into it?
After using your own summary for a while, you start to become in sync with the market. You will begin to recognise the chart and time frame without even needing to look at the pair or time frame window.
To some that may sound odd, but to others reading this, they will know what I am talking about.
What do you need to write for these 5 x pairs? Anything you see fit and that will help YOU.
Checkout the weekly price action trade setup ideas for example charts and some ideas.
This will ebb, flow and change over time as you and your trading does and that is the whole point. It does not have to be a masterpiece. It does have to set your trading up and keep you in sync with the markets.
I will often recap something from last week, or what I am personally looking for this coming week.
Whilst this is not a trading journal, it can act as a journal for you to write down your thoughts about trades, the market, what you are thinking about the week ahead, and the week just gone.
You will also come to be extremely surprised as you look back on your past summaries and how you have changed and improved.
STEP #3: During Week: Move Through Charts Adjusting Levels & Hunting A+ Trades
Here is where you are going to create your habits for the rest of both your trading and your life.
Now you may think; oh yeah sure. However; stop and think about it. How you trade including time frames, methods and markets affects all parts of your life.
Trading affects everything!!
The time you go to bed, what you are doing with your time during the day or night, what you can and cannot do with your spare time. Even your family and friends are affected.
By this point you have your major levels and you are on the hunt for A+ trigger signals.
Depending on what time frames you are profitable and comfortable with, you may be looking for technical analysis triggers on the daily charts or smaller time frames.
Read more on Moving From Daily to Intraday Chart Trade Setups
The key in this step is like we went through above; be fast, efficient and logical.
We want to move through each of our daily charts that have our daily levels marked and are first looking to see if price has moved into one of our major hot zones.
We don’t want to spend a ton of time on each chart. Price has either moved into the level we have marked as important on the daily chart or not. That is why we spend time going through the charts and setting up carefully at the start of the week!
With this in mind…
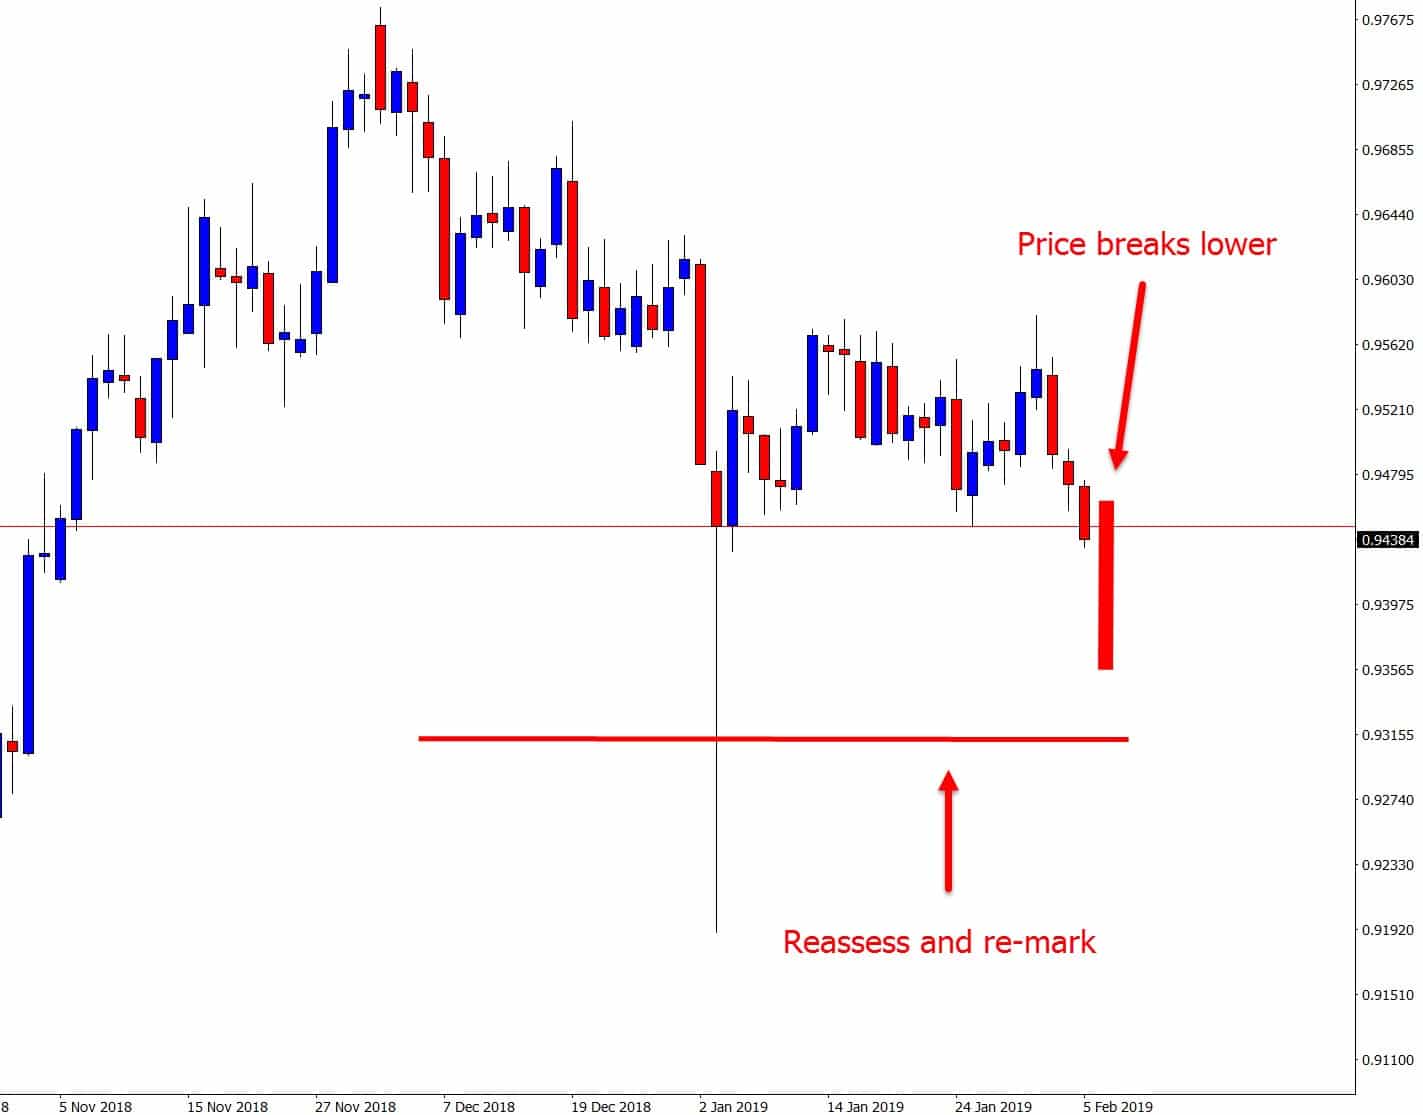
If price breaks right through one of your daily marked levels without technical analysis confirming a setup, you reassess and remark your levels (Because one level will no longer be applicable).
And remember; a maximum of two levels; one above and one below. The reason you are remarking is because price has broken out of one of these levels higher or lower.
An example is below; first we had our main two levels. Then, in my illustration price breaks lower. We would then take out the higher resistance and reassess what we are looking to do.

STEP #4: Hunt For A+ High Probability Trades
If price moves into one of our levels, we begin hunting for high probability A+ trade setups.
The time frames you are trading will depend on what stage you are at in your trading and the style that suits you best.
You can take a quick Forex Quiz to see what type of trader you are.
If you are a daily chart trader only, then you will be watching price action on the daily charts to see what trade setups are produced when price moves into your major kill zones.
If you are an intraday trader making trades on the smaller time frames such as the 8/6/4/2/1 hour charts, then when price moves into your kill zone on the daily chart you will be watching the smaller time frames to see what the technical analysis is producing.
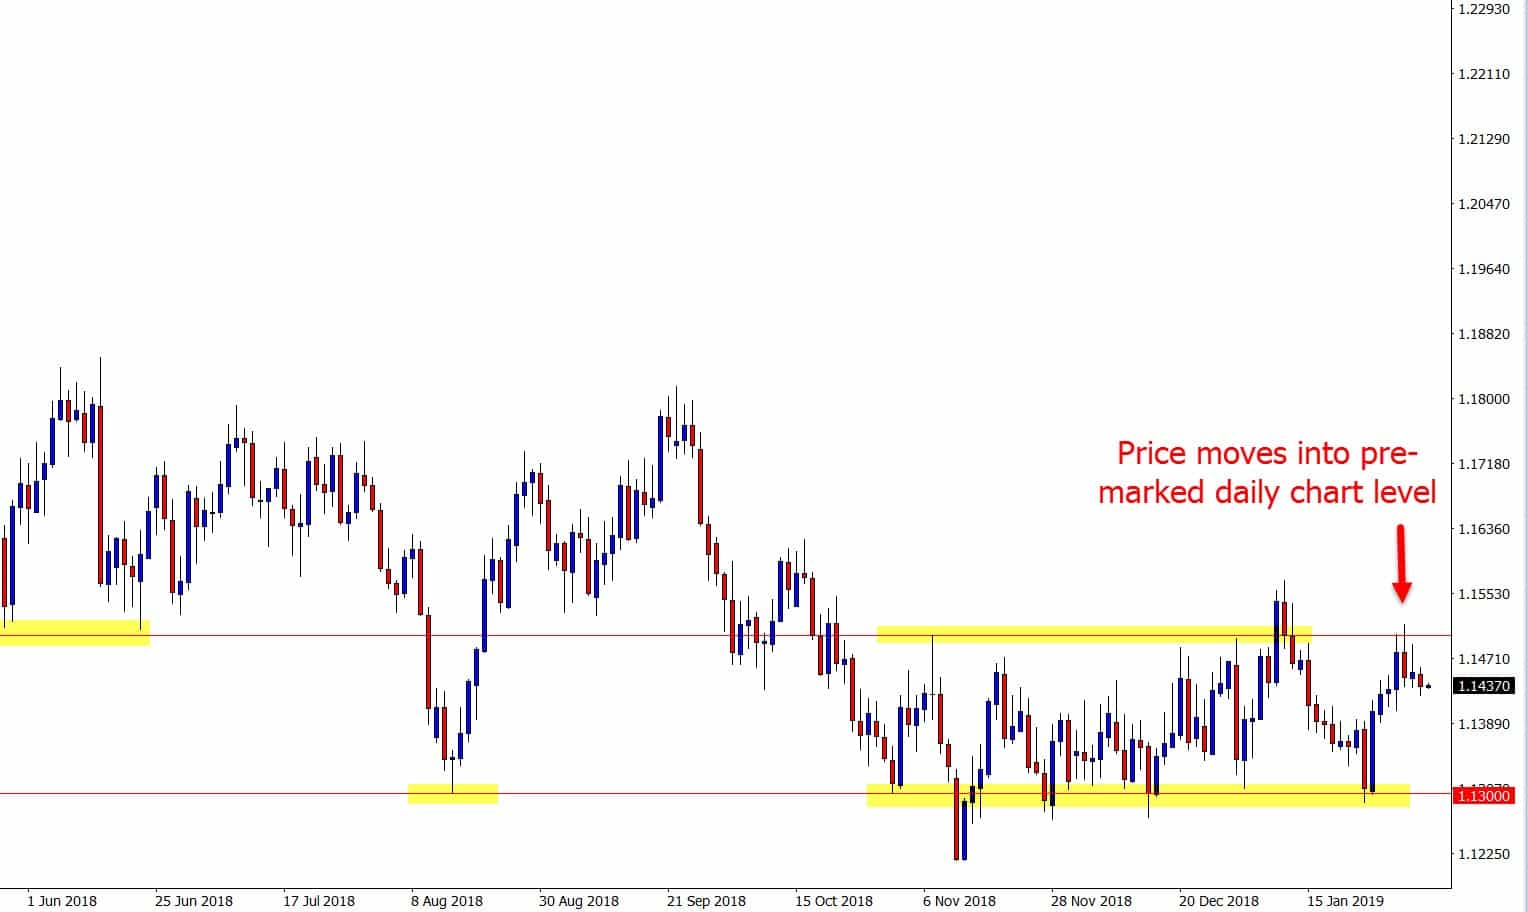
As the chart example shows below; price moved into a major pre-marked kill zone on the daily EURUSD chart. This is the time for intraday traders to look at their smaller time frame charts.
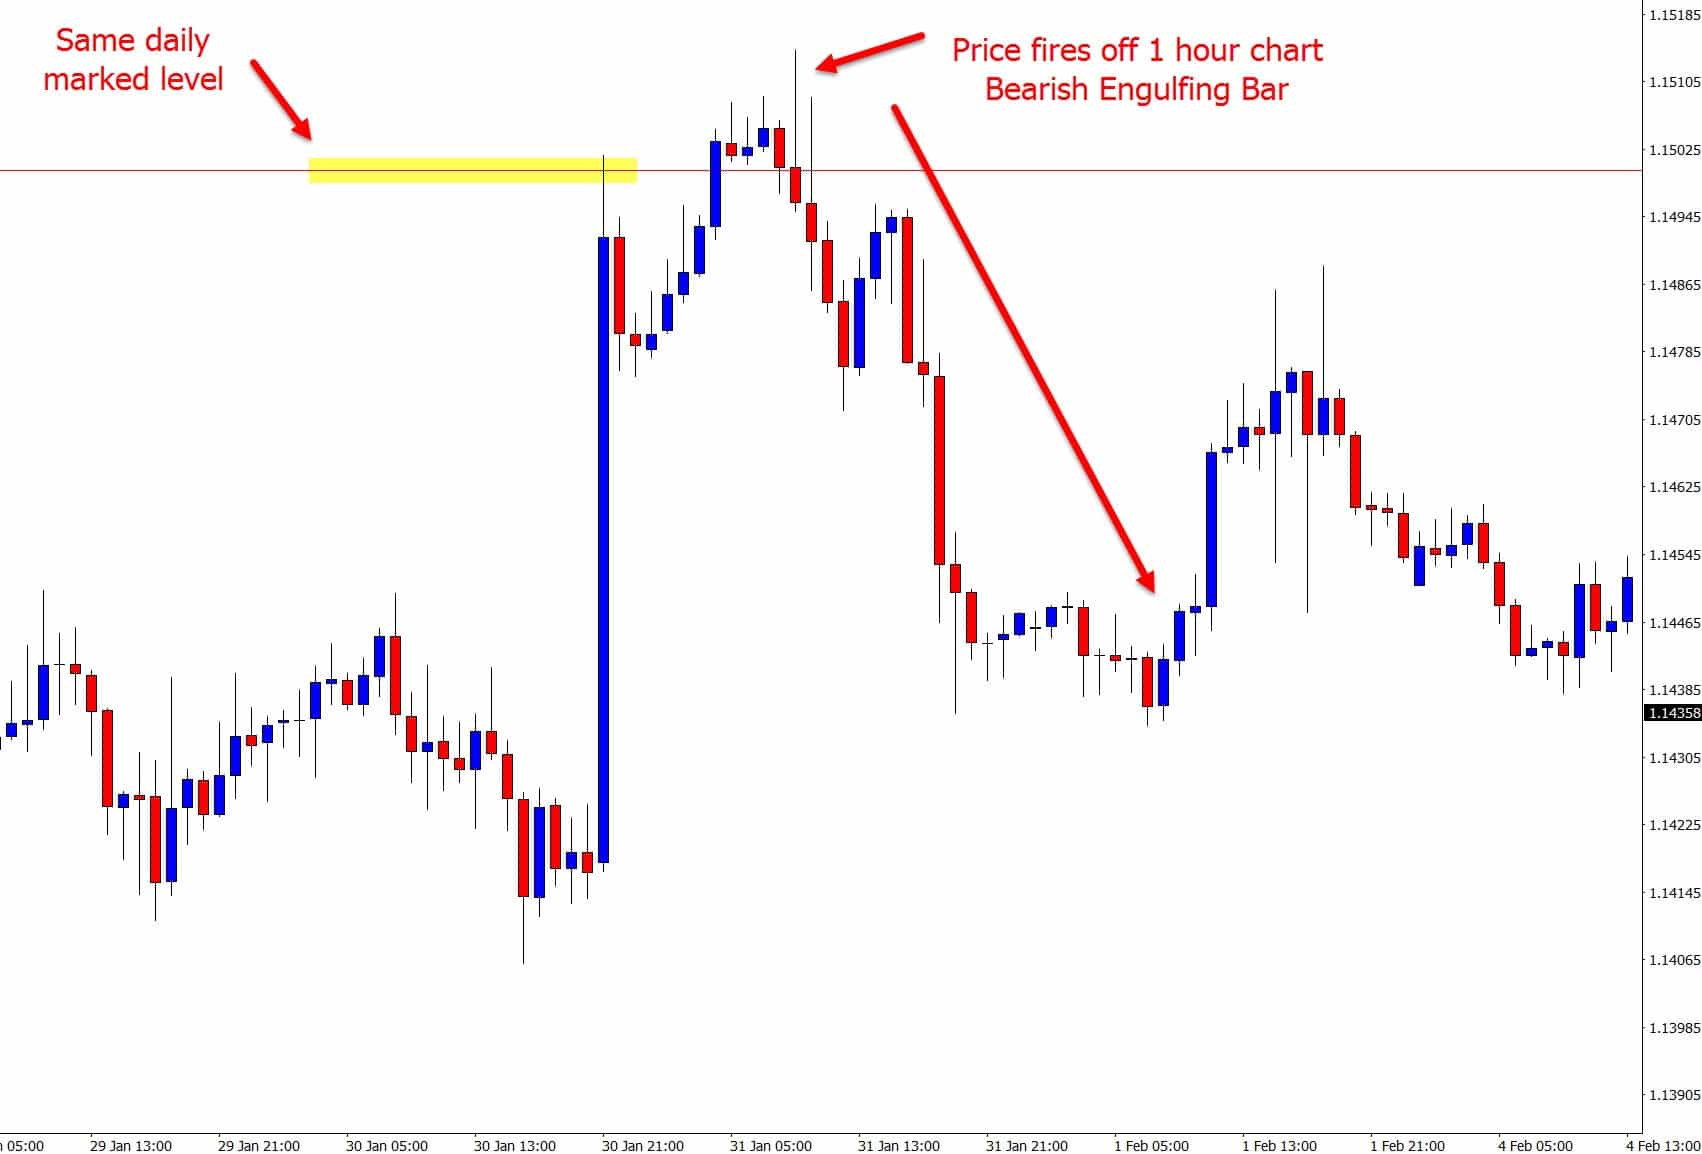
The second chart shows price action firing off a 1 hour Bearish Engulfing Bar at the same daily marked level signalling an A+ entry to get short.
STEP #5: Sunday Night: Reset & Complete Market Summary
This step is self-explanatory. You need to rinse what you have just done, and repeat it.
This for you and your time zone may not be exactly a Sunday night, but it is best done after the market has closed for the week, and before it has opened again to start a new week.
You need to create habits time and again that will pay you off time and again 😉
So there it is!
A step-by-step walk-through on exactly how to set up your trading week and create your own market summary.
This guide should help you mark your levels, create your own routine, save you time and make sure you play trades from the best levels.
This is fairly long and in-depth, but you will soon get the hang of it and instead of just flicking through the charts one at a time, you will be forced to really look at the chart and analyse them, and either pass or continue.
I hope you get a lot of this lesson. Let me know your thoughts or questions in the comments section below;
Safe trading,
Johnathon


Hi Johnathon
I’ve decided to start analyzing the market only based on H4 , finding hot areas, hunting signals, confluence and all on H4 and leave daily tf.
Do you approve of it? any suggestion?
regards
HI Mehdi,
daily levels are pretty crucial and by looking at smaller time frames only you run the risk of trading directly into or missing major area of supply and demand on the daily chart.
Safe trading,
Johnathon
thanks for your reply.
so can I analyze the market on H4 while holding daily R/S lines?
Please give this a read here; https://www.forexschoolonline.com//ultimate-guide-marking-support-resistance-price-action-charts/
Safe trading,
Johnathon
“Or, did you follow the pattern of a lot of traders; just plodding along from week to week, session to session, hoping that something will pop-up and you will be good enough to catch it when it does?”
You just described my attempts to find a trade for a couple of months now, and I watch daily charts. I will use these steps from now on. Thank you for this article!
Hi Matti,
nice to hear from you.
We were all new traders once!
We don’t know there is a better way until we learn or see it being done.
Safe trading,
Johnathon
How important it is for me thanks alot
Awesome to have you Bambang 👍
thank you Johnathon
You’re welcome Tabbrat 👍!
Awesome! Wish we could be having more of this. You are simply a genius. Thanks a million.
Thanks Paul! 👍
These in-depth 2,500 word guides take a long time to create and are created to help you so your comments are super appreciated.
Johnathon
How about including a couple of technical indicators, Johnathon ?.
Hi Elyott,
whilst I am sure many traders make a lot of money using indicators, and also trading news and many other systems, adding them to price action is not helpful.
Using indicators becomes a very slippery slope. We use only one for some confirmation and direction, and it works for a while. Then we lose and so we add another because we made some winners with the first. Then we add another. Before we know it out indicators all indicate different things.
As a price action trader we are watching, reading and trading price as it prints live on a chart and using our trading method to make and manage trades, we are not waiting for lagging indicators to tip us off. Will this always work; no. But, the idea is to create an edge where you make more profits than losses.
Hope this helps,
Johnathon
Thanks really good info. I think over a period of time for most of us struggling traders, we get lazy and just want to find the holy grail and not put in the effort. Appreciate your efforts to help.
Hi Tom
,
Agree.
Nearly all traders start with the wrong mindset; how to make as many trades, as much money as humanly possible and in as small of time frame as possible.
It is the traders who make the mindset shift into treating their trading like a real business, putting in the work that succeed.
Safe trading,
Johnathon