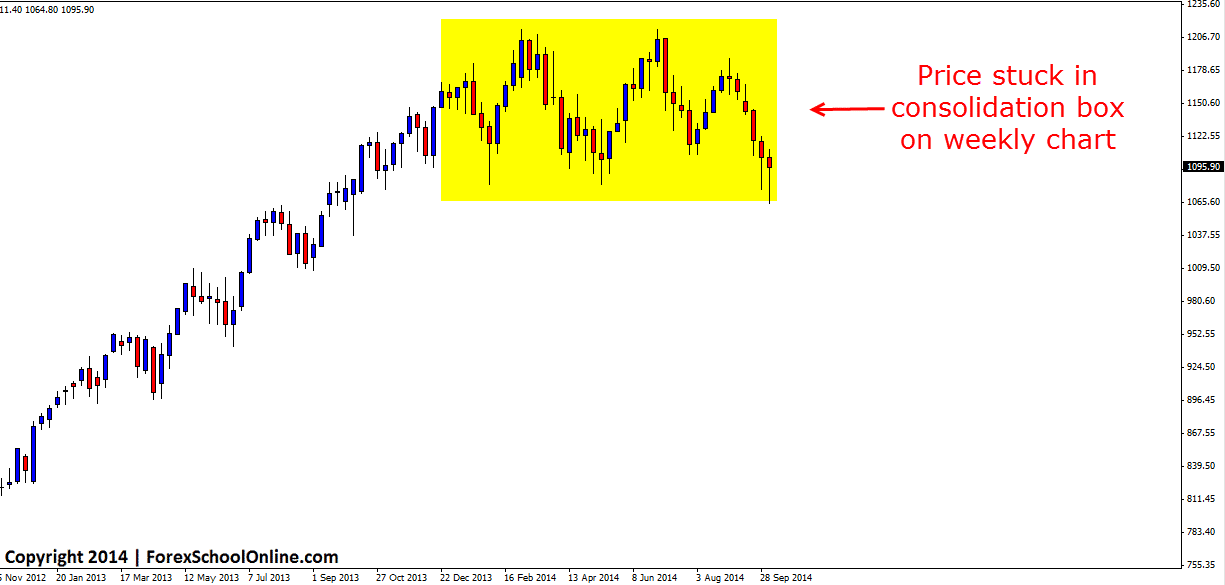
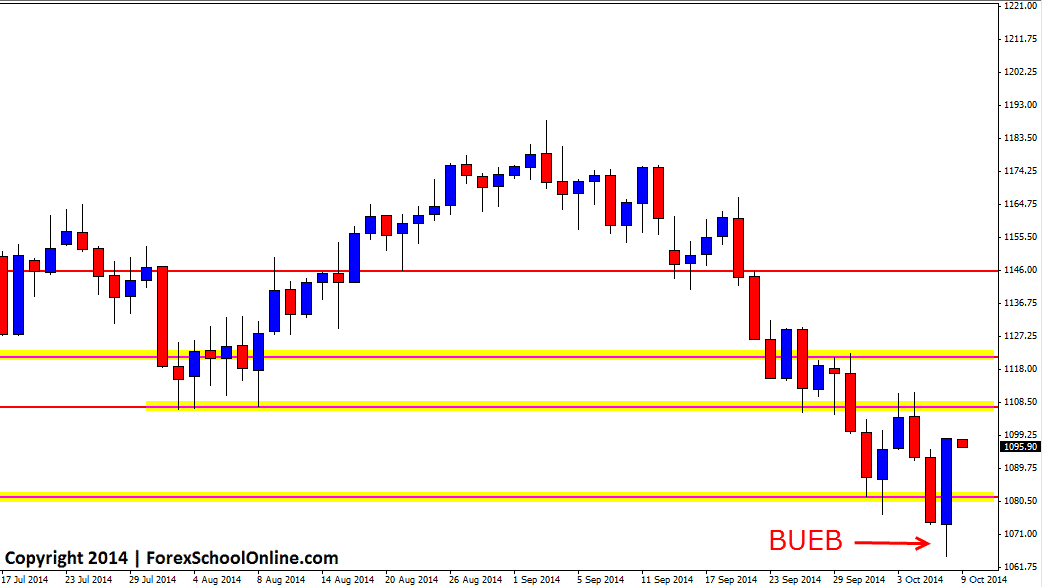
The Russell 2000 (US2000) has now formed a large Bullish Engulfing Bar (BUEB) down at the low on the daily price action chart. This engulfing bar is a large candle that is rejecting a major weekly support level as the chart shows below. This market has been in a very compressed and ranging market of late with price on the weekly chart trading in one large consolidation box and not being able to make a strong move out in either direction. Because of this, moves on the daily chart have been affected which is normal for compressed or range trading markets. As the daily chart shows below there are a lot of minor support and resistance levels and a lot of trouble areas for price to contend with if it is to move anywhere higher.
These are all things price action traders need to take into account when assessing their price action charts and the technical analysis of a chart. Whilst trades and setups can be played in all markets types, traders need to be aware and temper their trading to the different market environments.
If price can break higher from this BUEB there is one of these near term resistance levels sitting close overhead around the 1107.20 level. From there if price can gain momentum and break higher, there looks to be a bit of space into the next resistance. These tightly compressed and ranging markets are the most tricky to trade because price is so uncertain with so many levels to worry about that traders really have to be on the lookout. If price moves back lower and below the major support and demand level, then traders could use the strategy I discuss in the trading lesson here about Taking High Probability Trades From Intraday Charts to look for A+ trades.
Russeel 2000 Weekly Chart

Russeel 2000 Daily Chart


Leave a Reply