Oil Forms 4hr Pin Bar Reversal at Key Daily Support Level
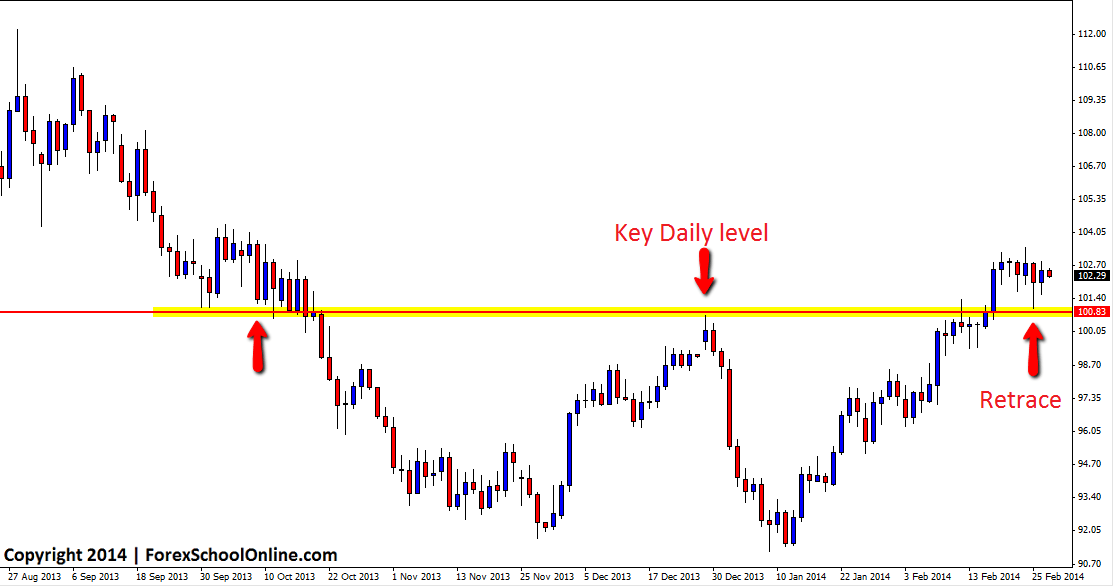
WTI/USD (Oil v USD) has been in an up-trend of late with price making a very fast and aggressive move higher in recent times. Regular readers to this blog will know that; the best way to trade price action is by looking for obvious trends and then looking to trade within these trends, rather than trying to fight them and this is exactly the case with this market. In a recent post I made on the 19th Feb in this blog that you can read here: Oil on March Higher on Price Action Charts I discussed looking to trade with this trend on both daily and intraday charts such as the 4hr and 8hr charts, if price rotated back lower and into a value area such as the key daily support.
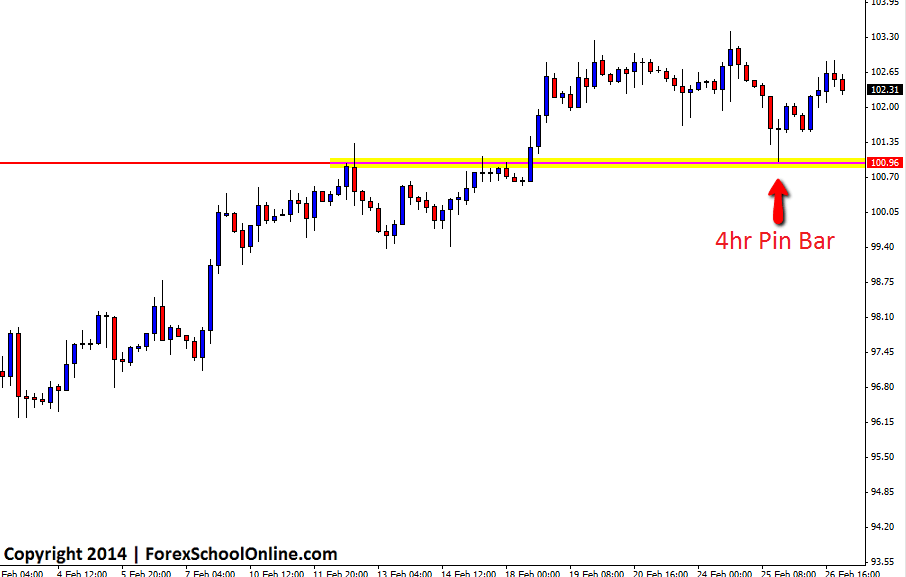
Price did rotate back lower and into the key daily support level on the 4hr chart and fired off a pin bar reversal down at the low and rejecting the support level. Price was a little choppy, but the price action story was very strong with the strong trend higher and the key daily level. Once the pin bar was confirmed price move higher and is now looking to test the recent swing high.
Oil Daily Chart

Oil 4hr Chart

Silver Breaks Out of Wind Up With Bearish Engulfing Bar
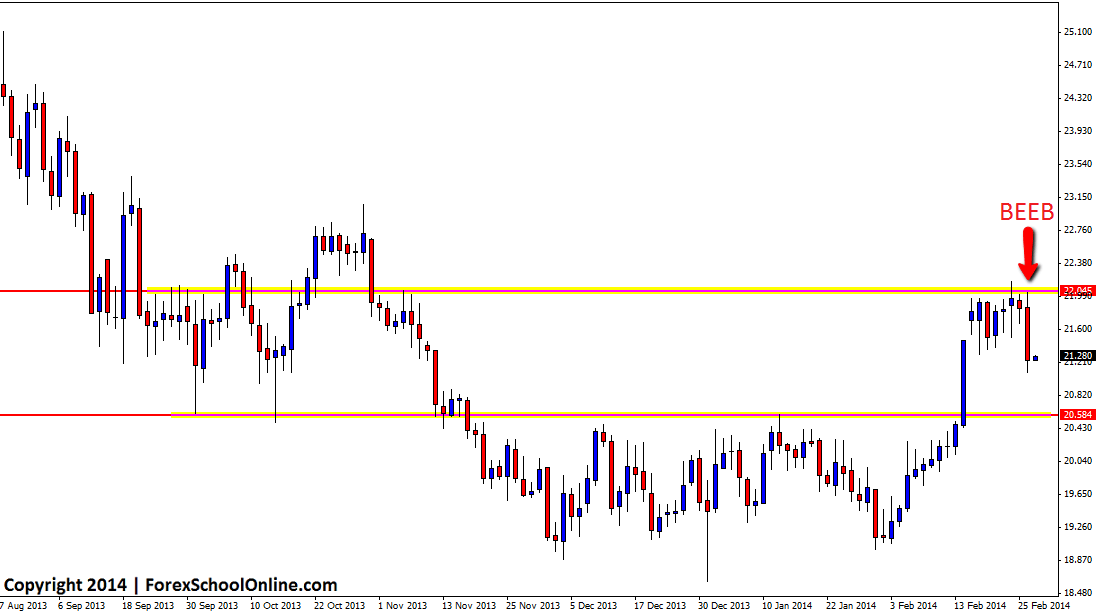
In yesterdays blog we posted about the Silver daily chart winding up with the last candle forming an inside bar. You can read yesterdays post here: Silver Winding Up On Daily Price Action Chart. The recent momentum was higher, however price could not bust through the resistance overhead that price has been struggling to get past and after trying to move higher one last time, price collapsed and has now formed a bearish engulfing bar (BEEB). This BEEB has closed outside the wind up area and if price can break the BEEB and confirm it, then it would not surprise to see price move into the next major support which is the old breakout resistance area around 20.55. This area is a major support area and held as a major breakout area that price could not break for an extended period of time. If price makes it back down to this level it could act as a solid level for price to bounce from and potentially look for long trades in what is at the moment a very sideways trading market.
Silver Daily Chart


thnx johnathon fox