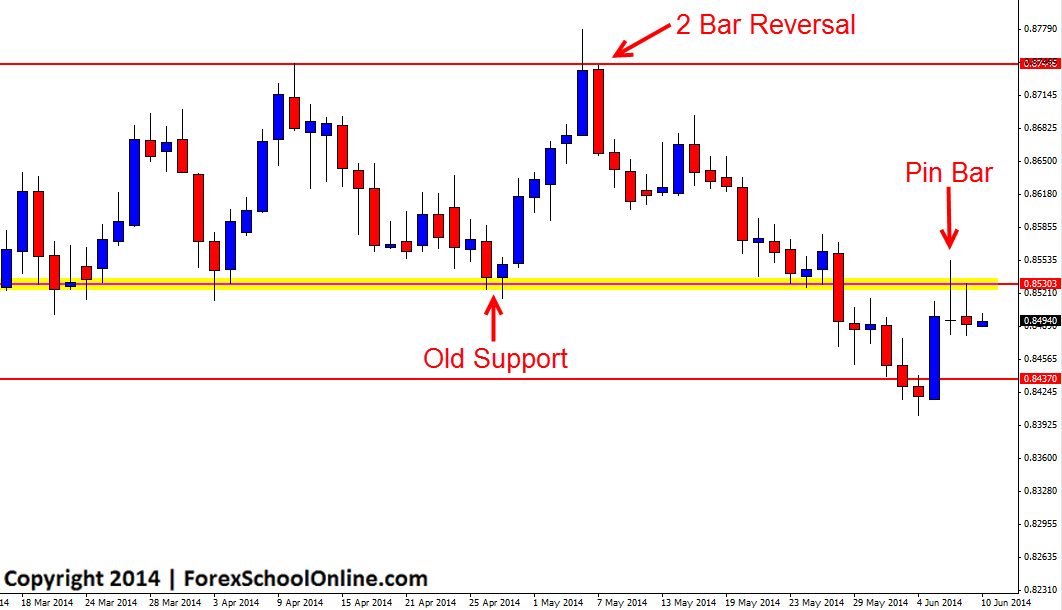
The NZDUSD has printed off a price action pin bar on the daily chart. This pin bar is sitting up at the high and rejecting an old support level that is now looking to flip and act as a new potential resistance. During the daily session after the pin bar, price has tried to break lower, but as often happens after a pin bar, price is now consolidating. As the chart shows below; during this session price has had another crack at moving back higher and through the daily resistance, with the high of the daily candle rejecting the resistance.
For price to make any decent moves lower, price will need to confirm the pin bar by breaking the low. If this happens and price makes a move lower, the near term support comes in around the 0.8435 area which is also the recent swing low where price found it’s most recent support.
If price can’t make a break and moves back lower, then the major resistance in the way is the price flip level that price broke through on the way lower. If price is going to make it’s way back higher it is going to have to break this resistance level and if this happens, the resistance level would flip to become a new resistance.
NZDUSD Daily Chart


Leave a Reply