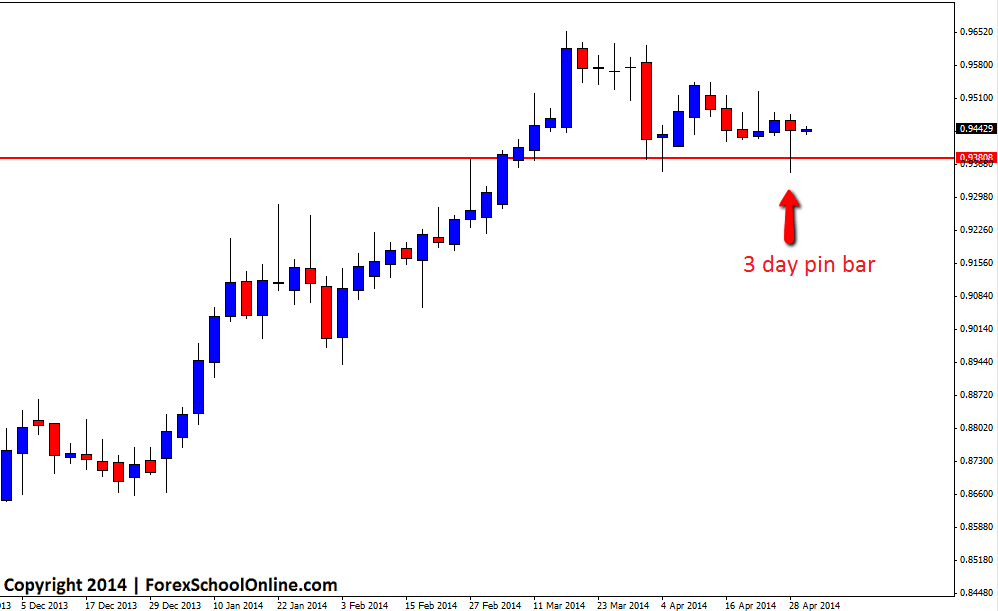
The NZDCAD has fired off a pin bar on the 3 day price action chart after price had been consolidating and winding up. Price has been in an extended and obvious up-trend in this pair with price in recent times making a huge leg higher with not many rotations lower back into value areas.
Price recently found a high and bounced back lower and it was here that price started it’s stalling/consolidation period. Price has then move to the low of the consolidation period and busted through the support, before then snapping back higher and forming the pin bar reversal on the 3 day chart.
Because of the recent consolidation period, there are some traffic levels overhead for price to move through if price does move back higher. If price does move back higher, the first resistance on the 3 day chart comes in at around 0.9520 and the next is at the recent highs. If price moves lower, price would need to make a solid close below the key support level for any potential new trend change and new trend lower.
If you want to learn how you can also change your MT4 charts so that you can make any time frame you want such as the 3 day chart like below, read this lesson here: MT4 Time Frame Change Indicator
NZDCAD 3 Day Chart

Related Forex Trading Articles & Videos
– How to Change MT4 Time Frames to Make Any Time Frame You Want


Leave a Reply