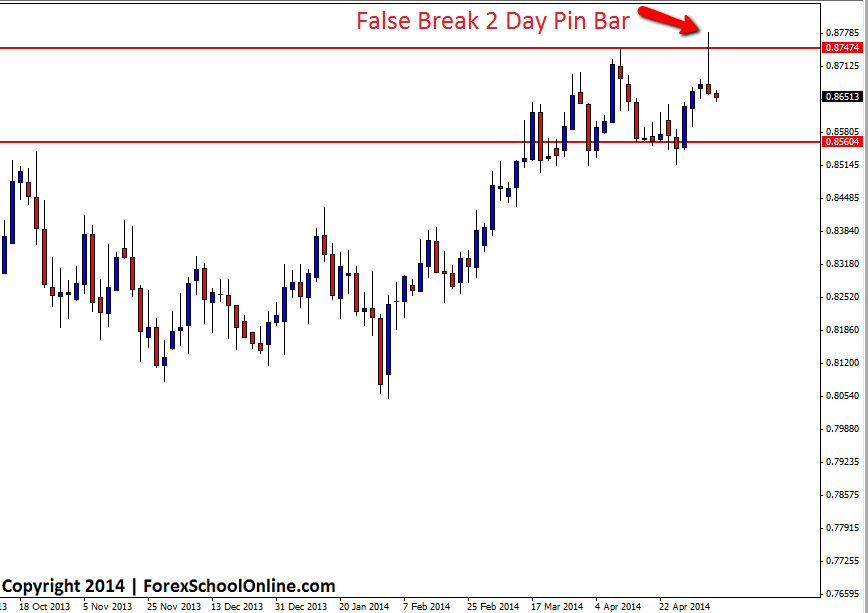
The NZDUSD has fired off a huge False Break Pin Bar on the 2 day price action chart. This pin bar is making a clear false break of the recent swing high resistance zone, with price closing well below the key level. During the session price moved higher and through the resistance level. This would have activated a lot of breakout traders thinking that price was making a breakout higher. Price then snapped back lower which would have caused a flurry of these breakout traders stops to have been taken out which has then meant a huge amount of momentum has been created in the quick snap and false break move back lower. I go into more detail about false break moves in my recent trading video here: Live Daily Price Action False Break Pin Bar Setup
If price can confirm the false break pin bar like we discuss in the trading lesson on how entries should be taken with the pin bar, the first issue for price breaking lower is the first support area that is sitting directly under the 2 day pin bar at around the 0.8638 level. This level could act as a support area and a trouble spot for price trying to push lower. If price can successfully move through this area however, there then looks to be some space for price to move into the next support area around the 0.8560 area. Alternatively; if price breaks higher, it will need to make a strong close above the recent swing resistance level before traders could then start looking for that level to start holding as a price flip and new support area.
If you want to change your MT4 charts so that you can make any time frame chart you want like the 2hr chart below, read here: MT4 Change Time Frame Indicator
Keep an eye on this blog each day for follow ups and other daily market commentary after the New York daily close.
NZDUSD 2 Day Chart


Leave a Reply