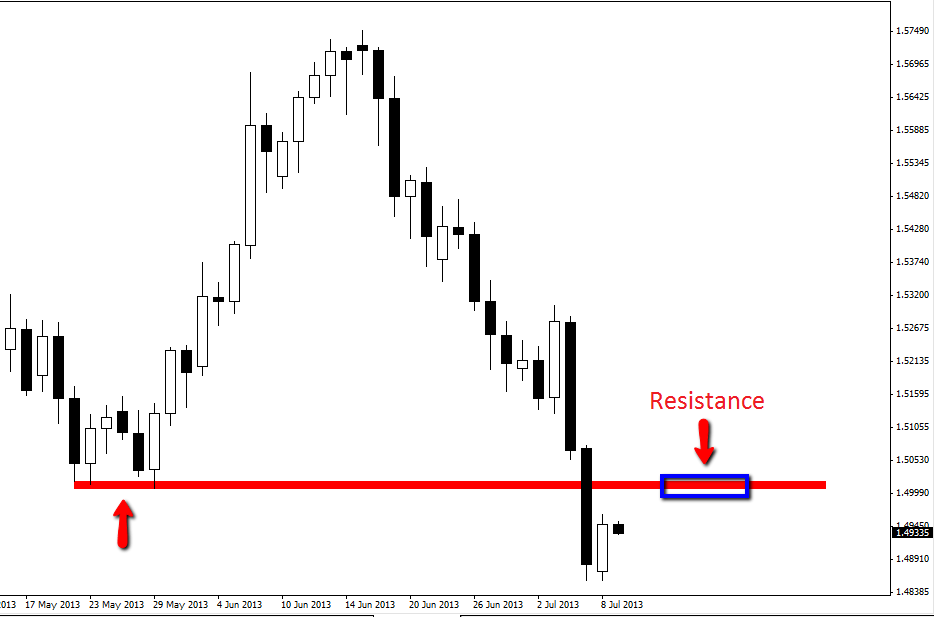
Price on the daily chart of GBPUSD has been moving lower solidly recently with the last leg being a huge down leg. Price has broken a key support level on the daily chart and moved down to test the major support at the extreme lows.
Price has tested this support level and at this stage it has held with price moving back higher. Traders could look to get into short trades if price continues to move higher and moves into the old support area which may act as new resistance. The daily chart below shows this old support area which may act as new resistance and a logical area for traders to get short.
Traders could look for trades on either the daily or intra day time frames such as the 4hr/8hr charts. If price breaks lower and breaks the recent lows a major move and new trend lower could be on the cards. We will stay all over it in this blog.
GBPUSD DAILY CHART | 9 JULY 2013


Leave a Reply