Price Flip: Old Support / New Resistance Strategy
The First Test Support/First Test Resistance or FTS/FTR is a super powerful trading strategy to get price action traders into high probability trades when done correctly.
As I am about go through in this lesson; when taking reversal trades, it is crucial that they are taken from both a swing point and a value area in the market. Just like any good business in day to day life, Forex is no different in that to make money traders need to buy low (cheap) and sell high (expensive) to make money.
A big mistake that many traders make when entering reversal trades is to enter at the end of the big money, just when the big guys have made their profits and are cashing in their trades.
Instead of doing the easy and buying low and selling high, traders will often buy high and then look to sell even higher. I cover this in-depth in a trading tutorial How Professionals Trade Forex and Hunt Stops.
The First Test Strategy when used on the correct time frames and done well ensures that traders will be trading from both a key daily level and a swing point.
What is the First Test of Support/Resistance Trading Strategy?
The First Test Support (FTS) or First Test Resistance (FTR) is a price action strategy used to get into trades from really high probability areas with the recent momentum when the key support or resistance level is at its most likely to hold.
Price is often breaking through key levels and it can be hard for traders to know what levels will and will not hold and what levels to hunt their trades.
Price action traders should always be using quality price action trigger signals such as A+ pin bars to confirm any potential price action setups at the key levels so they are not entering blindly, but when using the “First Test” method it increases the chances that the level will hold simply because of how the markets order flow is made up; more on that in a little while.
In both the Hunting Price Action Setups From Kill Zones and What Are Price Action Flip Areas? trading tutorials I discuss how traders can learn to target high probability trades when price breaks through a key level and then retraces back to test the same level.
In other words; price breaks through a key support or resistance level and then retraces to test that same old support or resistance as a new level. This is known as price flipping or old support becoming new resistance or old resistance becoming new support. Another example would be price breaking a support level and moving lower.
Price then retraces back higher to test the same old support which then holds as a new resistance level where traders can look for short trades at the old support which is now a new resistance.
With the First Test Support/First Test Resistance, the same method is being used accept that with this strategy trades are only ever taken on the first retracement back to the support or resistance and not the second, the third or more. This is very important and explained why below.
Whilst great trades can still be played when price is rejecting support or resistance for the second or third times, this strategy is all about setting up a high probability trade after a quick retracement and looking for price to make a really quick retracement back into a key area, not a long wait for price to make a re-test.
Why Does the FTS/FTR Give a Higher Chance of the Level Holding?
Before going onto explain how traders can use this method, and the time frames that this method should be carried out on, it first needs to be explained how and why it works.
The reason price is more likely to reject the support or resistance and hold on the first test, rather than on the 4th, 5th or sixth test is simply because of how the supply and demand is built behind the support and resistance zones.
Support and resistance levels are major build ups of supply and demand and where supply and demand has built to a level where the order flow has reached a tipping point.
Each time price tests a support or resistance level it is sucking more and more of that supply/demand out of the market. Unless that supply/demand gets replaced with fresh orders, the weaker the level becomes because the less supply/demand it will have behind it each time it gets tested.
The easiest way to think about it is like a group of bulls and bears each at their own support and resistance lines with the bulls protecting their support level and the bears protecting their resistance level both not wanting price to move through their level.
Each time price tests the resistance it takes a few more bears with it and each time it tests the support it takes a few more bulls with it and unless either of the bulls or the bears can find some reinforcements, eventually price will test the level until there are either no more bulls/bears to protect the support/resistance anymore and price will march straight through.
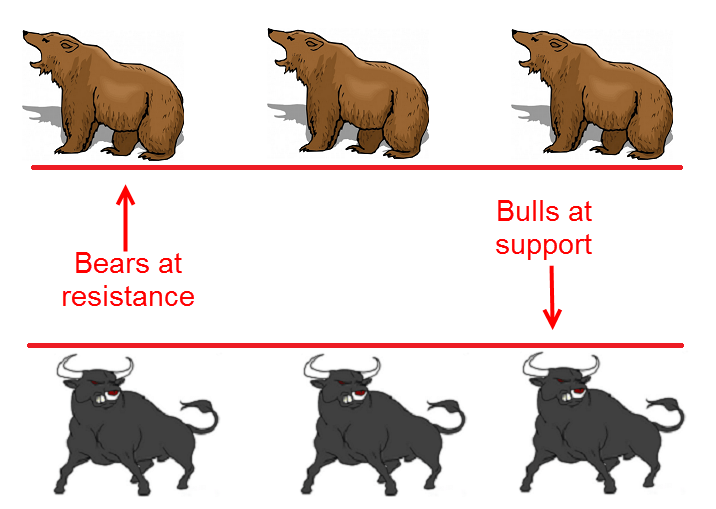
The first test of the level is when the supply/demand will be at its greatest because price has as yet to have been tested and this is why the first test of the level is the best time to look for a trigger signal and to make a trade.
Of course price can at times still move through the level and this is why we still need to match up these levels with high probability trigger signals like the setups taught in the Forex School Online Price Action Course.
Using The Daily Chart to Spot the Break
The first step to spotting the first test support/resistance is to spot price breaking a key level on the daily chart.
This is where traders must be really good at marking their key levels and have a really good routine that allows them to keep up to date with the markets. As the recent trading tutorial The Ultimate Guide to Marking Price Action Support & Resistance goes through it is so important that traders not only are good at marking levels, but also understand the order that they should be doing each process in.
It is super important that traders mark their levels on the daily chart and also watch for price to break out on the daily chart.
Not only will this ensure that the levels are really strong key levels that price is breaking out of, but it will also ensure that when the traders do go down to play a trade on a smaller intraday chart, they can have full faith that price has broken out of a daily chart.
Once price has broken a key level on the daily chart, then it is a matter of waiting to see if price does start to move back into the old support/resistance level. For example; if price broke lower and out of a daily support level, then the trader would be looking for price to move back higher for a test of the old support/new resistance.
Remember we are looking for a quick test and a First Test Resistance. On the daily chart we would need to see price move back and test the level in the next few days. We are not looking for price to make a long break lower and then come back in a few weeks, we are looking for a quick re-test. See the chart below for an example;
The chart example below shows how price on the daily chart burst below the clear support area and then within a couple of sessions made a really fast retrace back into the same old support area.
This is what traders are looking for. Traders are looking for an obvious break of a key daily area and then a quick First Test Resistance or First Test Support on the daily chart.
It is not the long break away and then retrace in weeks ahead that traders are looking for, but the quick break and retrace that traders are keeping an eye out for.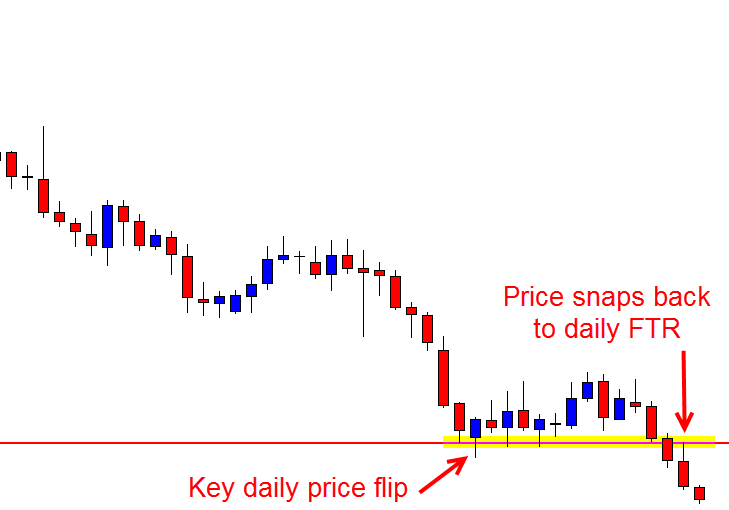
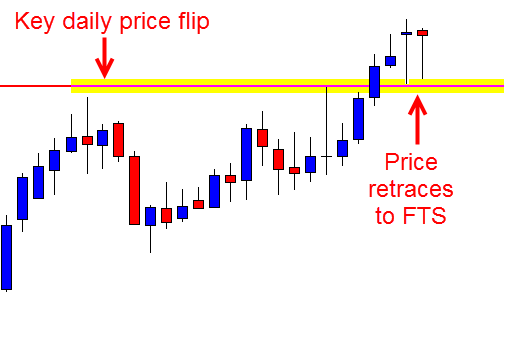
The second example is similar, but with price breaking higher through resistance and then quickly retracing back lower to the First Test Support.
Price was making a clear move higher, broke through the resistance and then quickly moved back into the FTS where traders would then be on high alert.
Move to Smaller Time Frames to Make Trigger Signal
Once the trader has spotted that price on the daily chart is moving in to re-test the daily level, it is time to move down to the smaller intraday time frames such as the 8hr, 4hr or 1hr charts etc, to look for a trigger signal to get into a trade.
Because price has pulled back sharply on the daily chart, there will be no space to play a trade on the daily chart. High probability reversal trades need to be taken at swing points.
Moving down to the smaller intraday charts will allow the trader to make a trade with space and from a swing point whilst also still taking the trade from the key daily area that is the First Test Resistance/Support. I discuss in the trading video attached to the lesson The Lessons Traders Can Learn From Candlesticks & Price Action how taking trades from daily areas on intraday charts works and how it opens up space to trade into.
Chart examples of how to take trades on the intraday charts when price has moved into make the first test on the daily charts key area are below;
Example 1:
The first chart is a daily chart showing how price first broke through a key daily support level and then quickly snapped back to make the First Test Resistance.
This quick re-test is exactly what traders are looking for with this strategy because whilst other high probability trades can still be made when price moves away and then retraces to test support/resistance in time, with this method quick trades can be made on intraday time frames with the momentum from the key levels.
Daily Chart
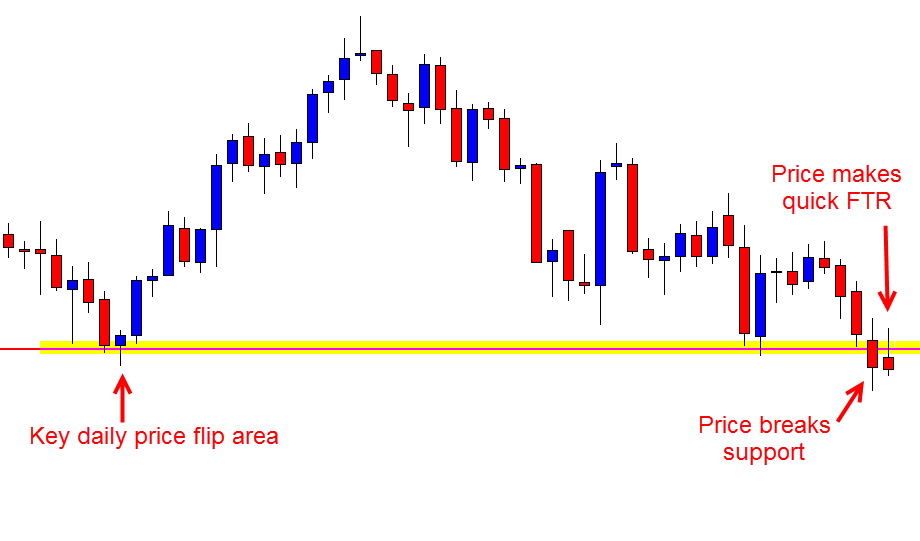
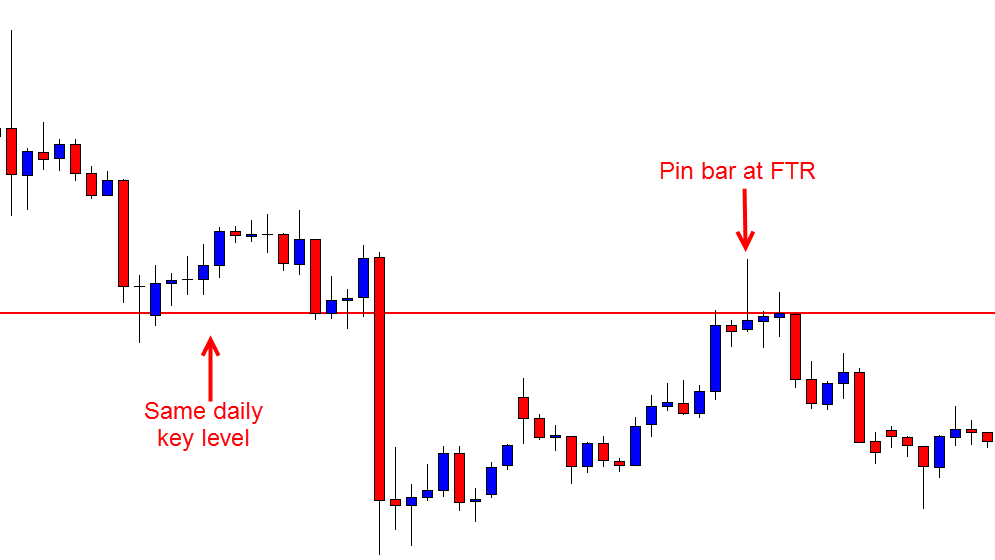
This second chart is the 1hr chart of the same pair as above. When traders start noticing price making a First Test Resistance on the daily chart they need to start hunting setups on their intraday charts and that is where this chart is showing how price moved higher and into the same daily key resistance and formed a solid pin bar reversal.
This pin bar would be the trigger signal for traders to enter a short trade and enter a high probability setup.
What traders also need to take note of is how on the daily chart there is no space, but making the trade on the 1hr chart means that traders are still entering from the FTR and a value area and the pin bar now has much more space to trade into from the correct swing point.
1hr Chart
Example 2:
This example is using the daily chart from the example previously in the lesson.
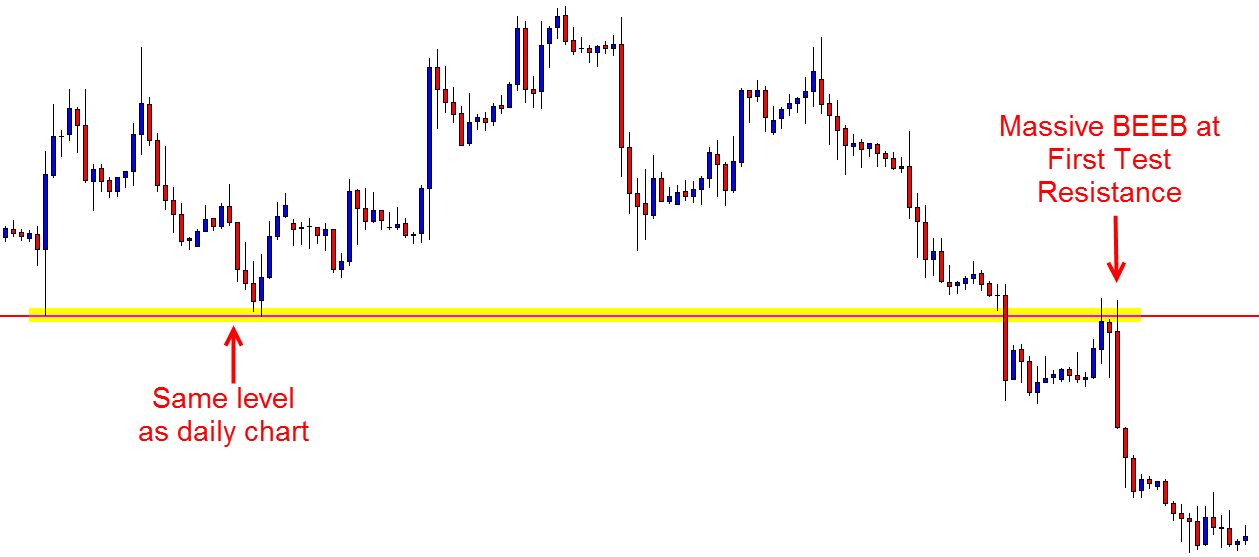
This is to show how after price has snapped back to make the FTR traders would have been then hunting for trades on their intraday charts for high probability price action trading setups. The 2hr chart then formed a huge Bearish Engulfing Bar (BEEB) that stuck out like a sore thumb at the FTR and went bang.
Daily Chart

2 hr Chart
Recap
For this strategy to work it is super important that traders first mark really good levels and then are alert to when price has broken their key daily levels.
Support and resistance levels in price action trading are really crucial components and something that traders need to continually every day go through their charts to make sure are in the correct spots.
Just like we discuss in many of our trading lessons; this strategy is no different in that you still have to cherry pick the best setups and you still have to let the market come to you i.e; don’t go forcing setups when they are not there to be made, but this strategy can be a super powerful strategy when done right.
I really hope you can take this strategy and practice, practice, practice until you make it your own!
Safe trading,
Johnathon
If you have any questions or comments I would love to hear them in the comments box below!


As always, great stuff. But how about if there’s no clear price action signal at retest, yet price zooms off. Must there always be A+ trigger signal at retest before taking a trade, or are there other ways of identifying
price rejection at retest and what are these ways? Many thanks boss.
Heya Paul,
thanks! Sometimes price will move to almost the price flip, but not quite and then bang we have missed it.
Other times price will move into a really solid area to look for a trade, but not fire off a trigger.
You can either move on and look for next potential trade or use two strategies.
First is watch other time frames for the price action clues or triggers. The second is to use something called a touch trade. I don’t go through it on this site, but basically it is using the price action story to find an entry without a trigger signal.
Safe trading,
Johnathon
Hi Johnathon
Right after taking some of the signals market goes into range mode maybe for a couple days.
should we wait or accept the small loss and close the the trade ?
regards
Hi Mehdi,
you would normally create pre-trade plan.
See here; https://www.forexschoolonline.com//increasing-your-profits-with-trade-management-planning/
Johnathon
thanks mr jhon
Welcome 👍
Hi Johnathon
sometimes signal comes up near the S/R line for example 20 pips to the line.
are these signals reliable?
regards
Hi,
this is common especially when the market is making a strong move. It will make sharp pull-back and then quickly continue.
You need to make sure levels are super accurate and then decide if you are A) happy to risk getting into false trades when it does occur and you are happy with the overall price action story, or B) wait until you get the setup you are looking for somewhere else.
Safe trading,
Johnathon
Hi Johnathon
thank you for your great article.
Is trend important in this strategy?
regards
Hi Mehdi,
this is not a trend trade, but you are watching to see the momentum, ie; a break with momentum and re-test.
Checkout more in recent video here; https://www.forexschoolonline.com//breakout-trading/
Johnathon
Thank you guru johna. I’m from Nigeria. What I understand from ur article is ..I should always draw my key levels on DAILY CHAT and watch out for signals at smaller time frame like 1hr? Pls I’m right ?
Hi Aladelusi,
marking daily levels is a great start.
You don’t have to look for setups on just the smaller time frames. You can use the same levels to find daily trades also.
Safe trading,
Johnathon
Hi Reeza, in regards to your question;
“thank you sir for your lovely article.
is bigness of the body of the engulfing bar or pin bar important?
regards”
Yes, the size and momentum is one of the more important clues to look at in the recent price action and the trigger especially.
Big and powerful is often big and powerful momentum.
Safe trading,
Johnathon
ya,SR flip/RS flip sangat bagus sya juga trade menggunakan sr flip dan doble maru dalam snd.
Sir Jonathan, thank you for this knowledge. Thanks for sharing. Love you!
Nice Article
Thanks Sam.
Hi johnaton
It was so interesting article. What I would like to know is, when we should go to smaller time frame and look for the trigger signal? When the retrace candle has formed or when the candle has not closed yet and still is testing the level?
Thank u.
What is the difference b/w immediate retest of broken support and retest after 6-7 days with bearish pin bar…. which retest works effective????
& if a pair broke a support and retested the support level with bearish engulfed bar instead of pin bar whether we should trade that pattern or not…..
Namaste..
Hi,
you can trade both.
If price breaks and makes a quick re-test, the important thing is that you are going to be on a smaller time frame and you need to be prepared to be quick and ready to manage the trade. You also need to make sure there is enough space for that trade to be played into and that the reversal setup is at a swing high.
If price breaks and then comes back around, then you are most likely going to be on a daily or higher time frame chart and this is also a very solid potential setup.
No one way is better than the other.
Johnathon
thank you John
Hello John
let say the quick FTS/FTR produce a good pin bar on the daily chart I use to mark the key level.do you think its wise move to take the trade on a daily chart itself.?
Senzo
Hello Senzo,
the daily chart is a great time frame to take pin bars using this method if price has retraced back and is making a new test and is showing that new rejection with a pin bar.
Johnathon
Hi Johno, thanks for this great article. Now is super clear how this works. I’m practicing this along with the advanced course’s strategies. Is it important that the daily breakout is from a trending market?
King
Heya King,
I will send you an email regards this one.
Johnathon
Nice strategy! How many signals can one expect per month?
Hi Johnathon,
such a great and informative article you’ve written there, however I have a question, is it a must to mark the level only on the Daily D1 chart? Given the timeframe of chart is actually just fractals(with a lower volatility on the lower timeframe ofcourse), does it work if I mark the level on the H4/H1 chart and then go down into M15/M30 for a really short period trade? Looking forward for your reply.
Hello Vincent,
if you want to make trades on the 30min or lower you can still do it and using the same key daily levels. I have often made smaller time frame trades, but it is super important the daily charts levels are used. The time frame of the trigger signal is not important with this strategy, but how you find the level is.
The daily charts levels tell us a lot and the levels set the tone for the market.The daily levels are made from the 24 hours and every session in the market and where price can and cannot close above/below can quite often tell us a lot about price and what it is looking to do especially around the key levels. Any other questions let me know.
Safe trading,
Johnathon
Heya Steve,
good question. Whilst we only discuss it in members area; the BEEB is a setup that can be traded not just as a reversal but as a few other things such as an advanced continuation setup. Whilst there is more to this, what I was trying to highlight with this article was more just where to look for the first test back to target high probability trades and where to look for the trigger signals and not focusing so much on the trigger signals you use to get into those trades.
Hope this explains. Any other questions just let me know.
Johnathon
Hi Johnathon great article and very insightful. Please can you explain one thing to me though… We are taught to take trades that are at good swing points where there has been a sufficient pullback so that when a price action signal is taken there is SPACE for it to trade into. Now on the 2 hour chart where you show that massive BEEB that does close below the previous swing on that chart and since we are supposed to take and manage the trade on the chart that the signal appears on then this does not really give us any room to move into with. Basically arent we just selling low? Your thoughts on this would be welcome please.
Brilliant Johno.. This is how high probability trades are taken and money is made. Been doing this for a while now and my consistency is very high! Thanks mate!
Nice one Paul! Super to hear you are already making good use of this strategy with consistent results.
Johnathon
So, are the trades entered in the same way i.e., on the break of that BEEB or on the break of the Pin in the previous example?
Hello Dave,
yes. Once you have found a trigger signal you then set it up, enter it and manage it the same way. This strategy is all about getting into a quick retrace and then using a trigger signal at the FTS/FTR as confirmation the level has held. Any other questions let me know.
Johnathon