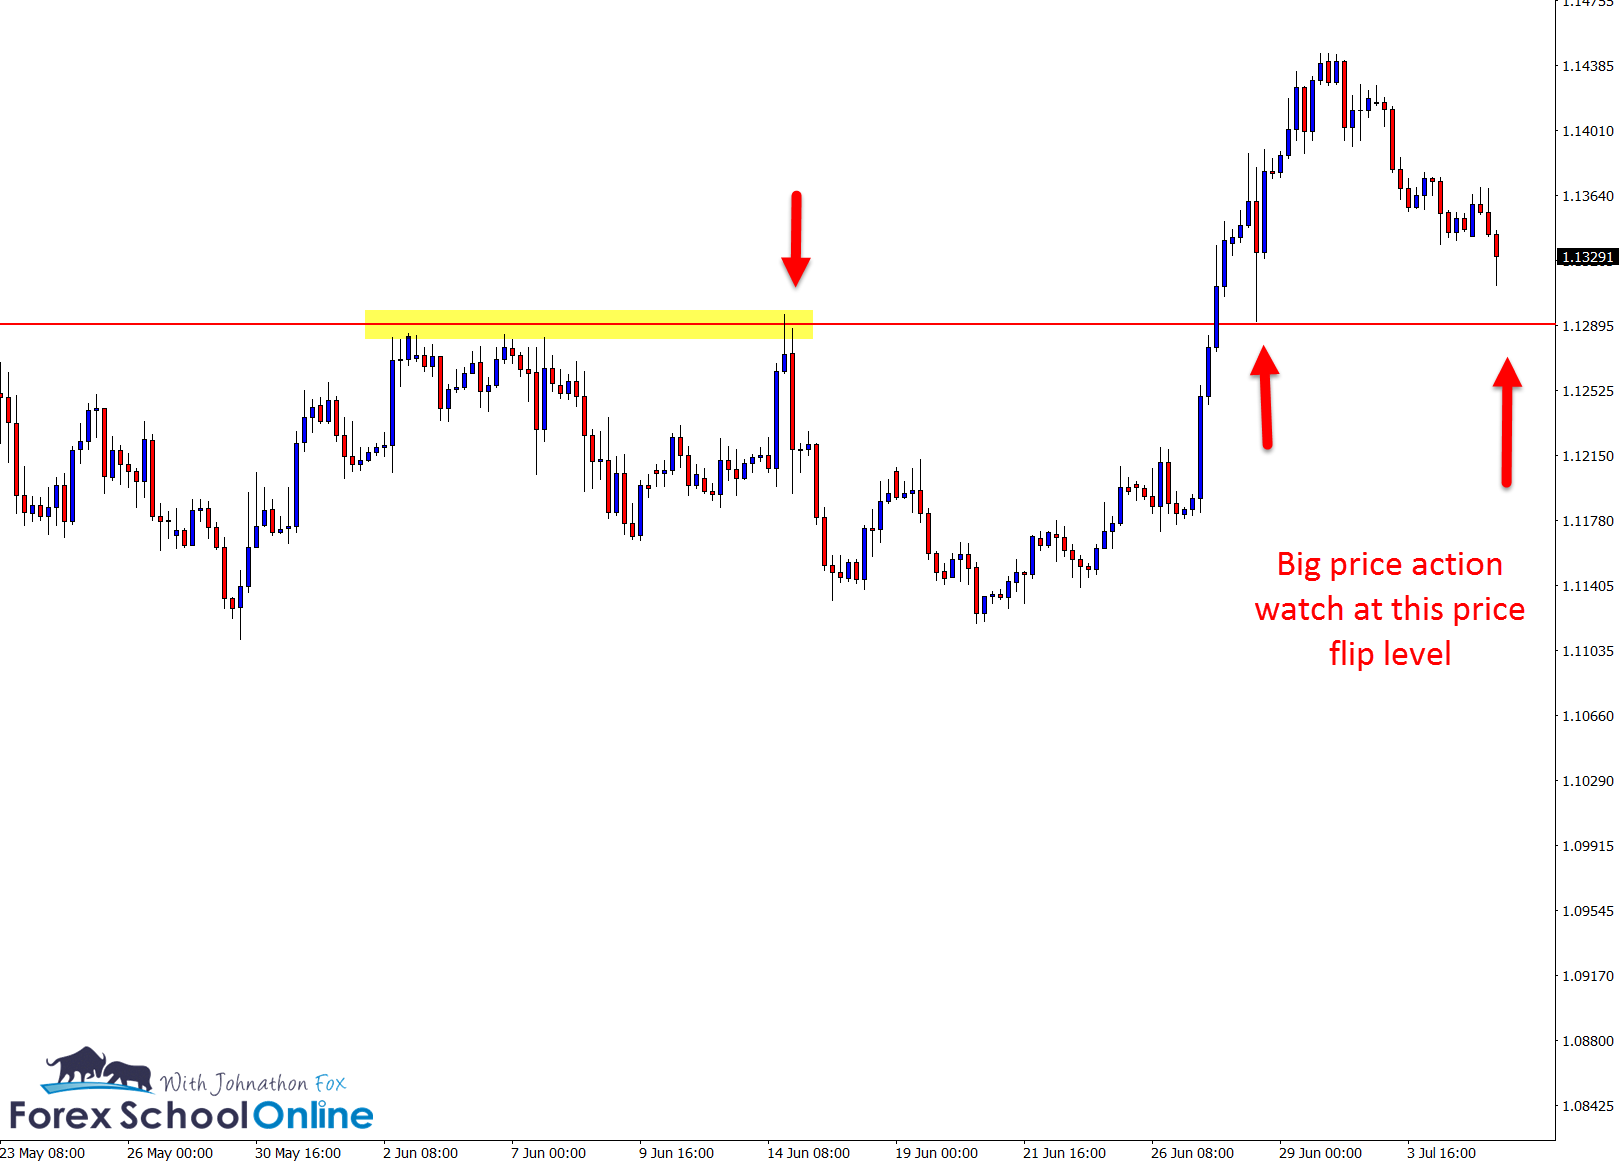
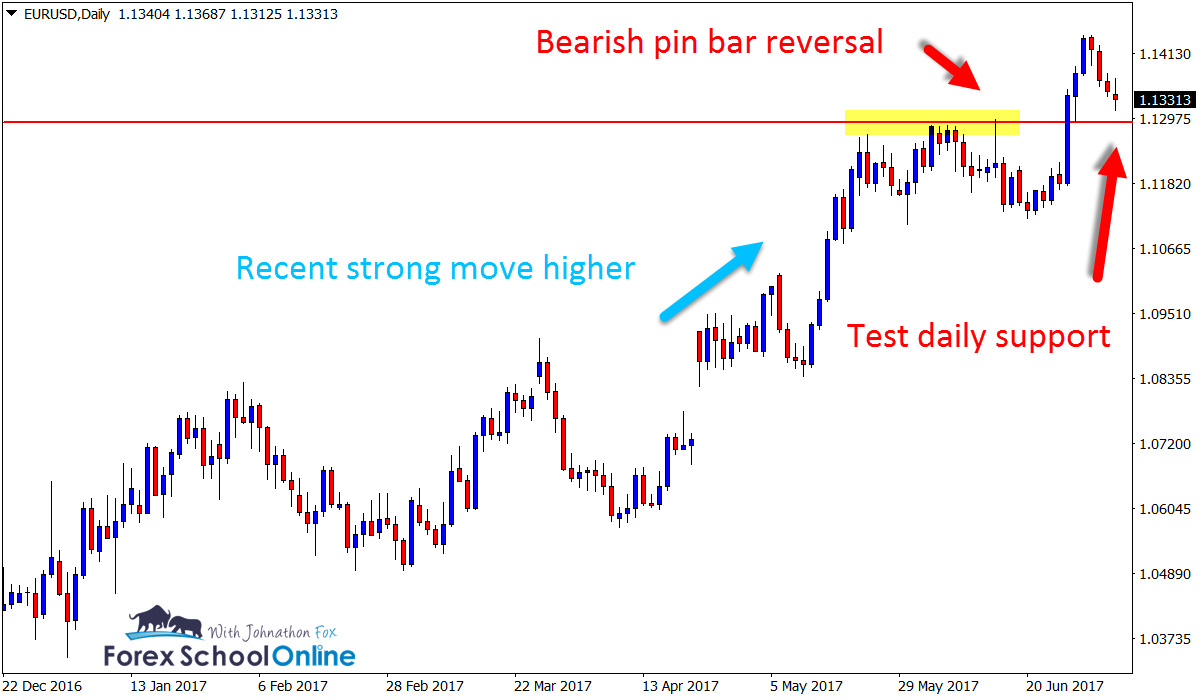
Price on the daily EURUSD chart is now making a pull-back lower into the price action price flip level, after making a super strong and aggressive breakout last week inline with the recent momentum higher.
This retrace lower is back into the old resistance and potential new support / price flip level that has been proven time and again on this chart.
As you can see on my charts below I have marked them out for you to highlight and clearly show the major level, but if you jump on your own EURUSD chart and zoom it right out you will notice that this level goes right back and is a major price flip level for a long way.
Before breaking higher and moving out, price had stalled just underneath this level which was interesting because price had finally started to gain some momentum in this market after months of doing nothing but going sideways.
Stalling and moving sideways are as common in the Forex markets as having a hot meal.
However, when we see it happen underneath a major level all bunched up like this and price making repeated attempts to break out, it tells us that if we do get a break and a quick re-test to the same price flip level it will be a super interesting level to watch!
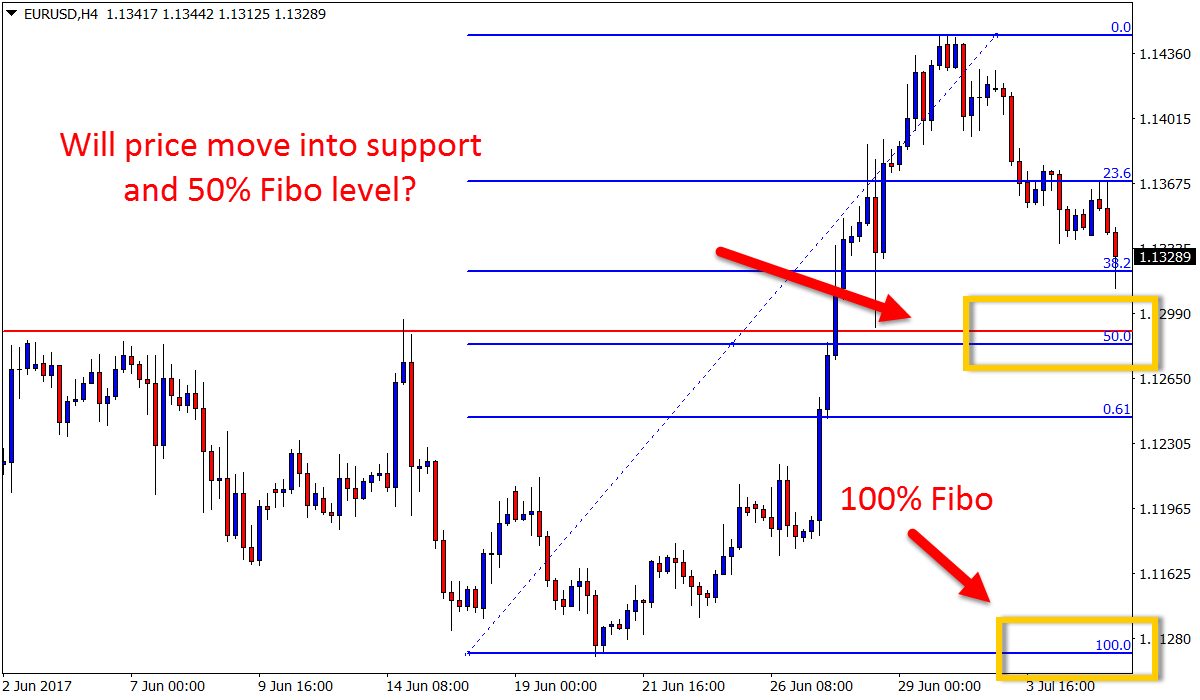
The next thing to note is the 4 hour chart – keeping in mind we are always piecing together the whole story and then making the trade… never making a rash trigger signal and then looking back and thinking or making up some sort of story to fit the trigger.
Fibonacci With Confirmation – Not by Itself
This 4 hour chart has a Fibonacci level inline with the same price flip level. I am not going to go into the Fibo here because if traders overuse it, it can lead to a ton of over-trading. However, it lines up around this same price flip level and is another tick.
You will notice that the level with the Fibo is blue and that is because as my students know; to cut down time as I go through my charts I color code my levels, so that when I flick through my charts I know what levels mean what and I don’t have to leave the Fibo on there messing up the whole price chart!
What Now?
If price does rotate back lower and into this solid support area we could watch for price action and see if any A+ high probability trade setups to get long form and if they do then enter them accordingly to our trading plans.
If you want to know how to make A+ trades from Kill Zones and price flips, then read this lesson.
If you have yet not joined our mini price action trading course, then you only have a few days left as we are only running it this week. You can get the first video lesson here;
EURUSD Daily Chart
EURUSD 4 Hour Chart

EURUSD 4 Hour Chart


Leave a Reply