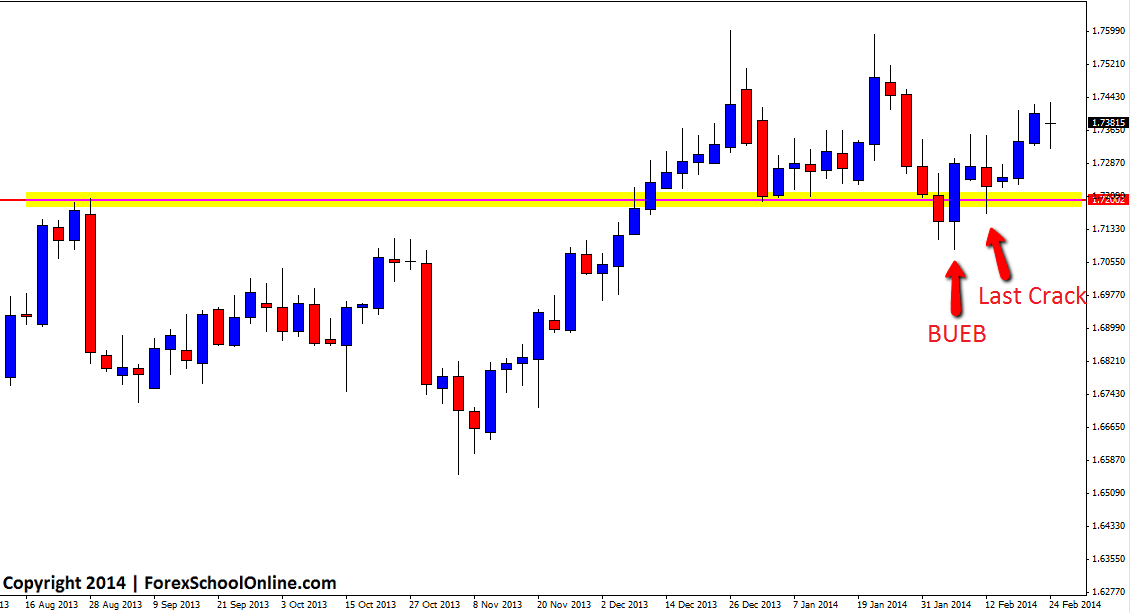
EURSGD Bullish Engulfing Bar
The Bullish Engulfing Bar (BUEB) that formed on the 3 day chart of the EURSGD that we posted in this blog back on the the 11th of Feb when it formed live has now finally started to move higher and broken through the overhead consolidation area. You can read that first original post here: EURSGD Forms 3 day Bullish Engulfing Bar
After confirming the BUEB price moved higher only to be halted by the overhead consolidation area that was discussed in the first blog post. Price then moved lower and had one last attempt at moving back through the support level. The support level held and the bulls came in and pushed price back higher to where it has now worked it’s way higher and if it can continue it’s momentum, the recent swing high could be the next major resistance on the cards.
EURSGD 3 Day Chart

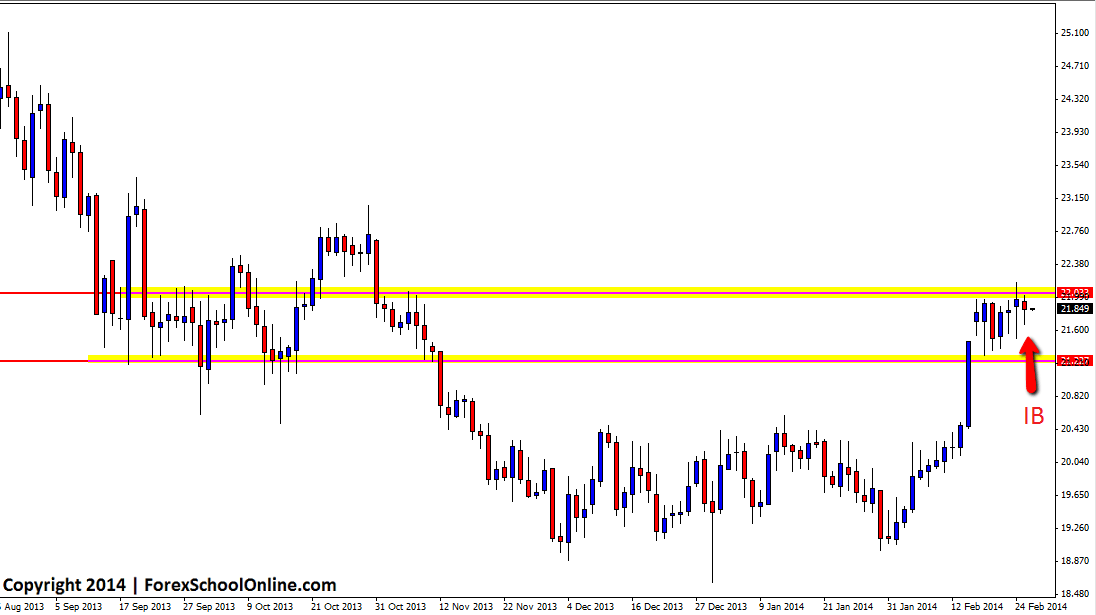
Silver Winding Up on Daily Price Action Chart
Silver has started to wind up with price forming a new inside bar on the daily price action chart. After being in consolidation for an extended period of time down at the lows, price eventually busted out and made a super quick move higher to be where price is now sitting. Quite often after quick moves price will make a pause before consolidating and getting ready for the next move and that is what looks to be happening in this market. As we often talk about in this blog; the longer price winds up, normally the bigger the eventual breakout is when it occurs.
As you can see on the chart below; price was stuck in the consolidation period down at the lows for an extended period of time, but once price broke out the breakout was extremely forceful because of the length of time price was wound up. The recent momentum has been higher on this pair which mean the odds are higher that price will breakout to the upside. If price does breakout higher, the next resistance levels come in around 22.40 and 22.85.
Silver Daily Chart


Leave a Reply