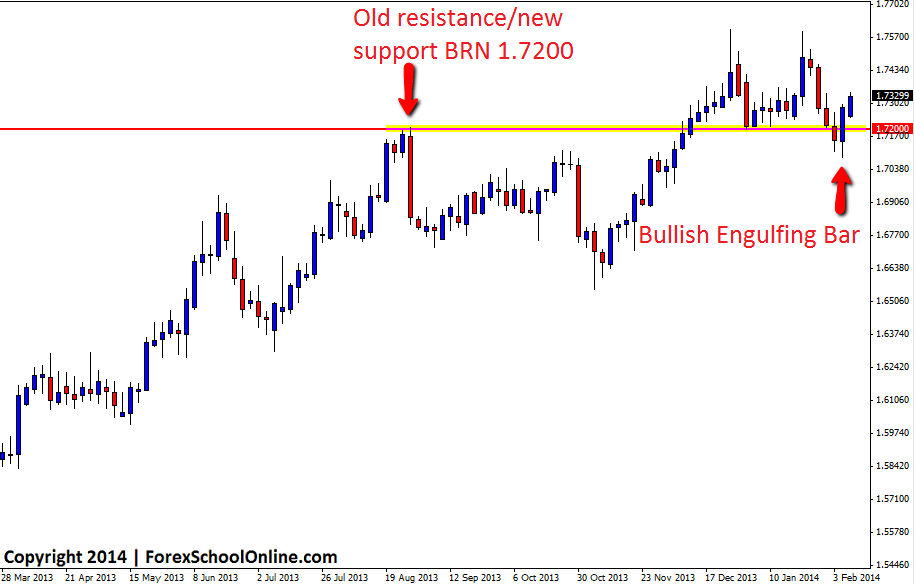
The EURSGD has started to move higher after breaking the high of a Bullish Engulfing Bar (BUEB) that was formed on the 3 day price action chart. Price on the 3 day chart has been in an up-trend in recent times before price found a high and formed a double top with price rolling back lower to hit a key support level where price has now formed this 3 day BUEB.
There is a slight consolidation area above the BUEB that price is about to encounter if it moves any higher and this could act as a trouble area, however if price can gain momentum and burst through this area, the next major resistance level will come in at the recent swing highs where price has formed the double top.
Should price roll back over from here, the first support level of note is the area that the BUEB is rejecting and also the Very Big Round Number of 1.7200 which if price can break would look to act as a price flip level and become a new resistance.
If you would like to change your MT4 charts so that you can make any time frame you wish and make 3 day charts like the chart below or make other time frames such as the 8hr and 2 day charts you see in this blog from time to time, check out this article here: Using the Correct New York Close Charts & Changing MT4 Time Frames
EURSGD Daily Chart


Leave a Reply