The Dow Jones has been defying the market rule that ‘price does not move in straight lines’ for many, many months.
We know that no matter how high price moves (or how much we will often as traders talk ourselves into things; which is how these markets are first formed) price does not move in straight lines.
There are major price action rules that price follows over and over again. This is simply because until people and traders start doing things differently, then the markets will continue to do the same things.
People will continue to fool themselves into thinking ‘this is going to be the one’ market, stock, currency, in history that does not go bang. They will hold too long, buy too high, sell through fear and panic and around it goes.
People buy things they would never normally because they are afraid of missing out and they sell for the same reasons. These are universal fears and they feed on each other.
Is the Sell-off that bad?
Whilst traders and commentators are going nuts about the biggest one day points move in history, in reality the percentage fall is less than 5% for the day or not even in the top 20 biggest falls… but the falling lower has continued the next day!
Take a glance at this market and the charts I have added below as it is quite incredible. I have been discussing it on the site for years and this run it has been making. Just a couple of these posts are below, but you can use the search box to find others;
Dow Jones Burst to All Time Record High For 15th This Year
Will The US 30 Break Into All Time Highs?
Dow Jones Roars Higher on Daily Price Action Chart
This was coming a long time!
This looks like the LONG, LONG, LONG overdue correction this market and others needed to remain healthy. I leave the economics and major fundamentals to the people who study them and spend hours reading, listening and perfecting them.
Trading stocks individually is a completely different ballgame to trading and making trades.
With one you are looking at a business and taking an investment in that business. Often you will receive income as the investor.
With the other you are purely in and out over the top to make money.
One requires you to study the ins and outs of the business, potential returns on your investment and income. The other does not.
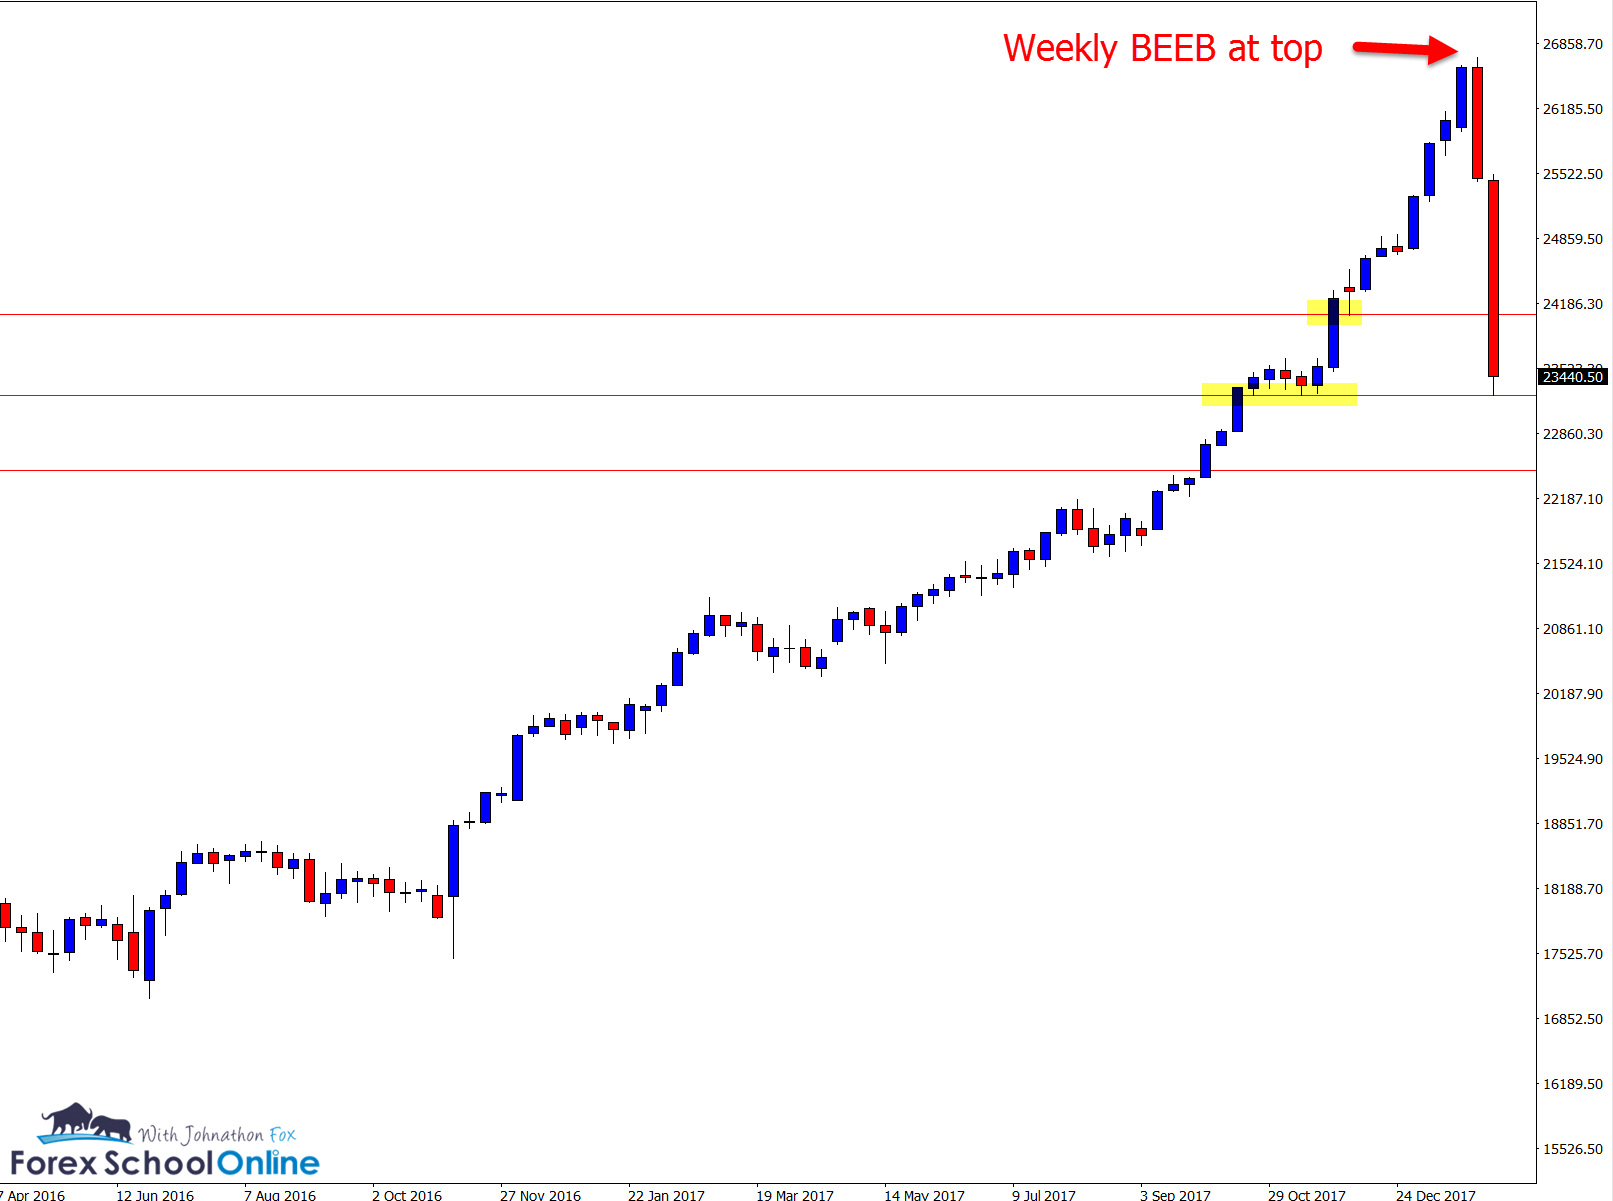
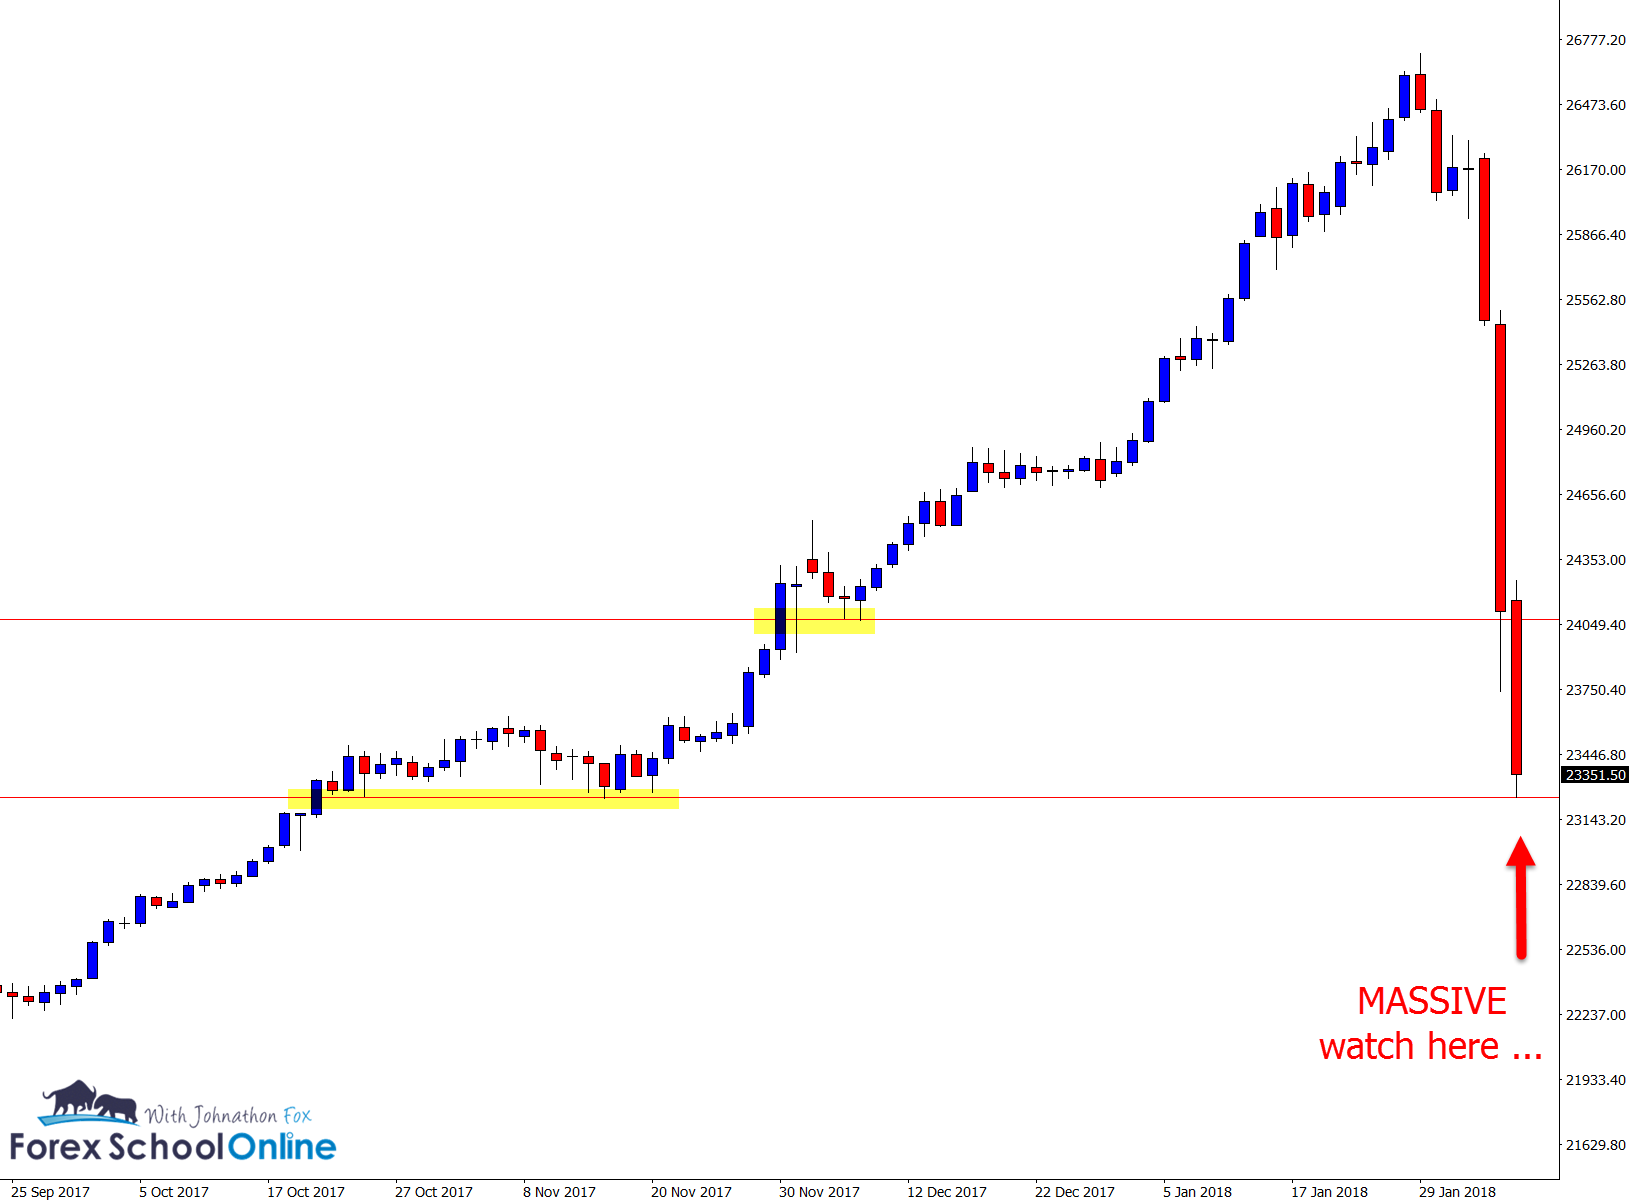
Dow Jones Weekly & Daily Chart
The charts below are clear cut and the reason for this is the huge and runaway steamroll higher.
The Dow Jones is now moving into a huge area of support as I write this. We could expect to see a huge battle and buyers to show some sort form of resilience at this level.
If this level breaks, then tonight in the US session should be incredibly interesting to say the least.
Weekly US30 / Dow Jones Chart

When price moves higher with such incredible pace as it has here, it leaves directly behind it a huge amount of space to fall back into.
This market has huge amounts of space to freefall back into which every other trader / business / economist / bank is watching and is super clear to see on these charts.
Daily US30 / Dow Jones Chart

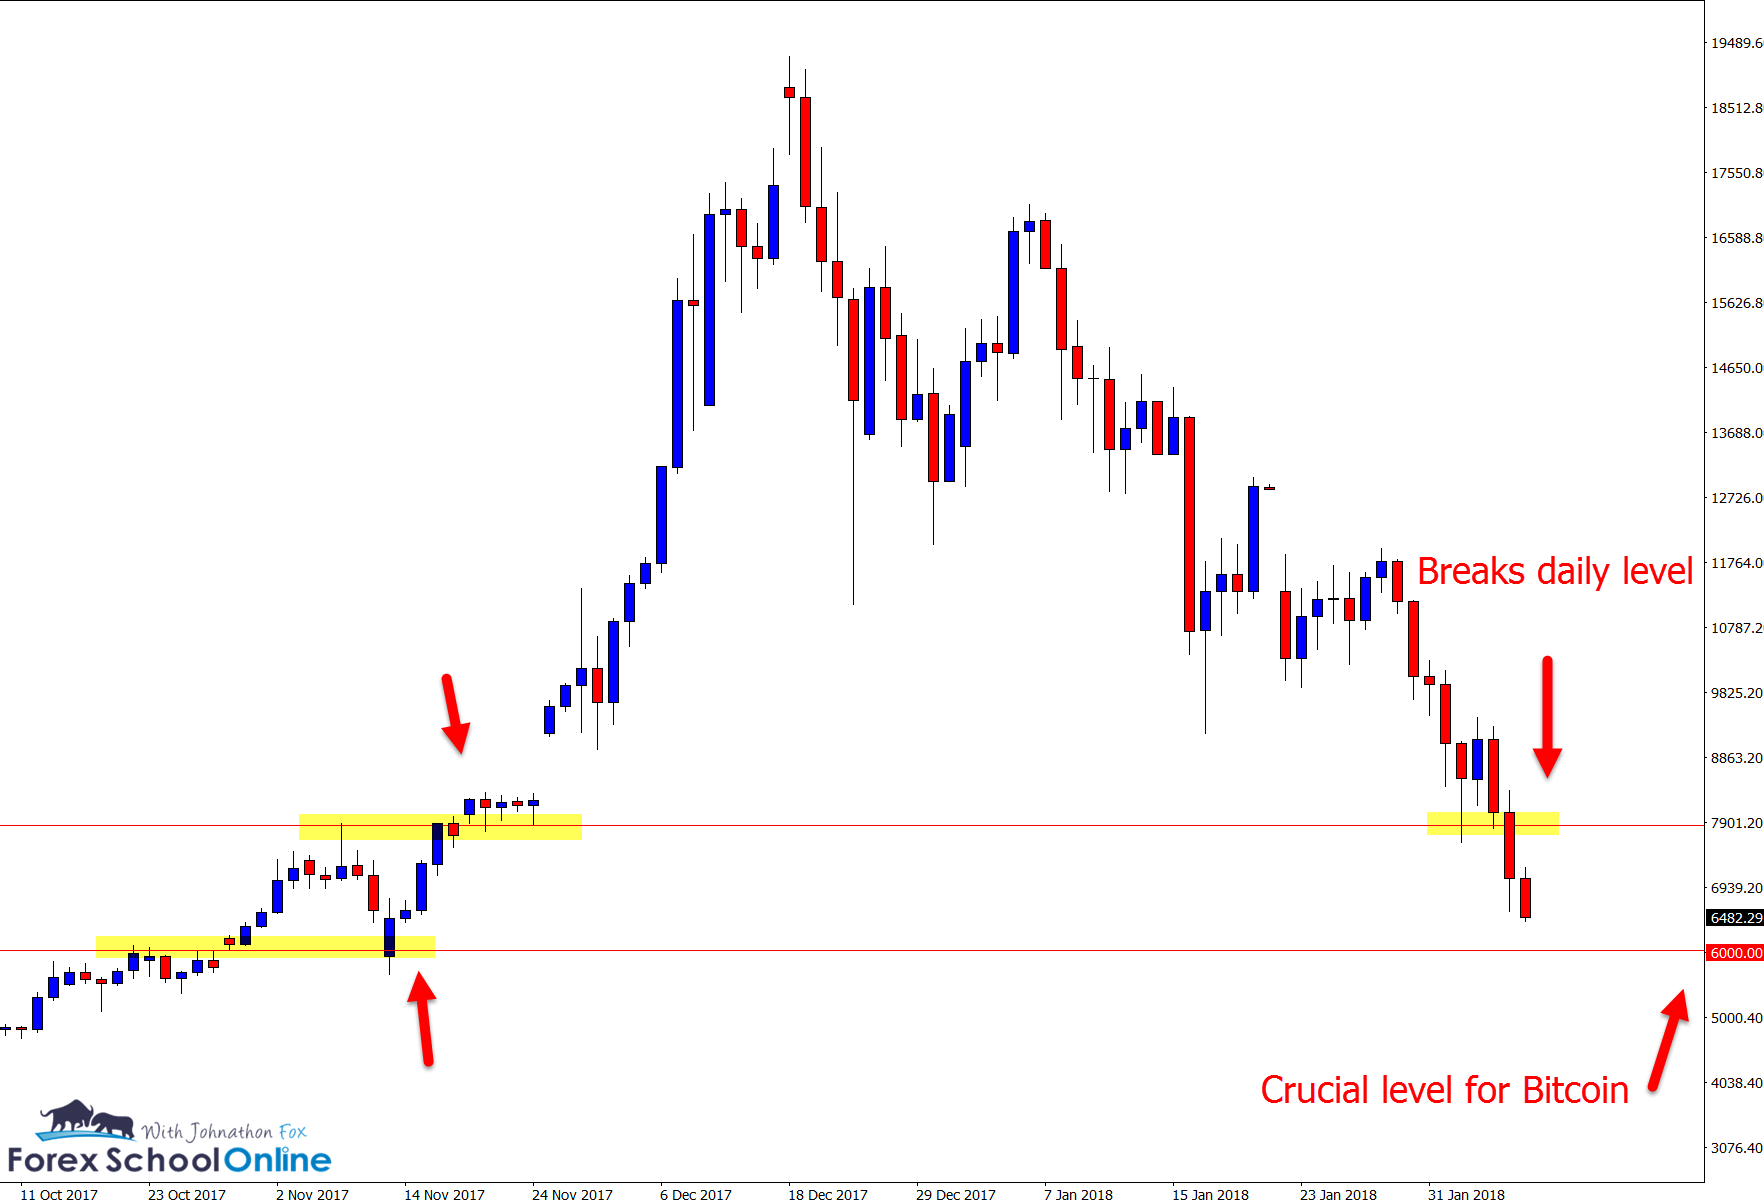
Bitcoin v USD
The two markets I have been watching closely for some time are the DJ30 and the Bitcoin market.
The huge reason I have kept a close eye on Bitcoin is because it has been at a huge crossroads on the price action charts.
As the discussion has been a lot more subdued of late with these cryptocurrencies, it has now broken through a hugely important support level and looks in danger of moving back down to the 6000 level from last year and from there who knows where it could go to!
Bitcoin Daily Chart


Leave a Reply