In our last ‘charts in focus’ post we discussed how both the GBPUSD and NZDUSD had been selling off and trending lower with large price action moves.
Whilst the GBPUSD had paused and was trading sideways getting ready to make it’s next move, the NZDUSD was in a down-trend with a potential price flip to hunt short trades.
You can read last weeks post and how to use these price flips to hunt high probability reversal setups at;
GBPUSD and NZDUSD Continue Selling Lower
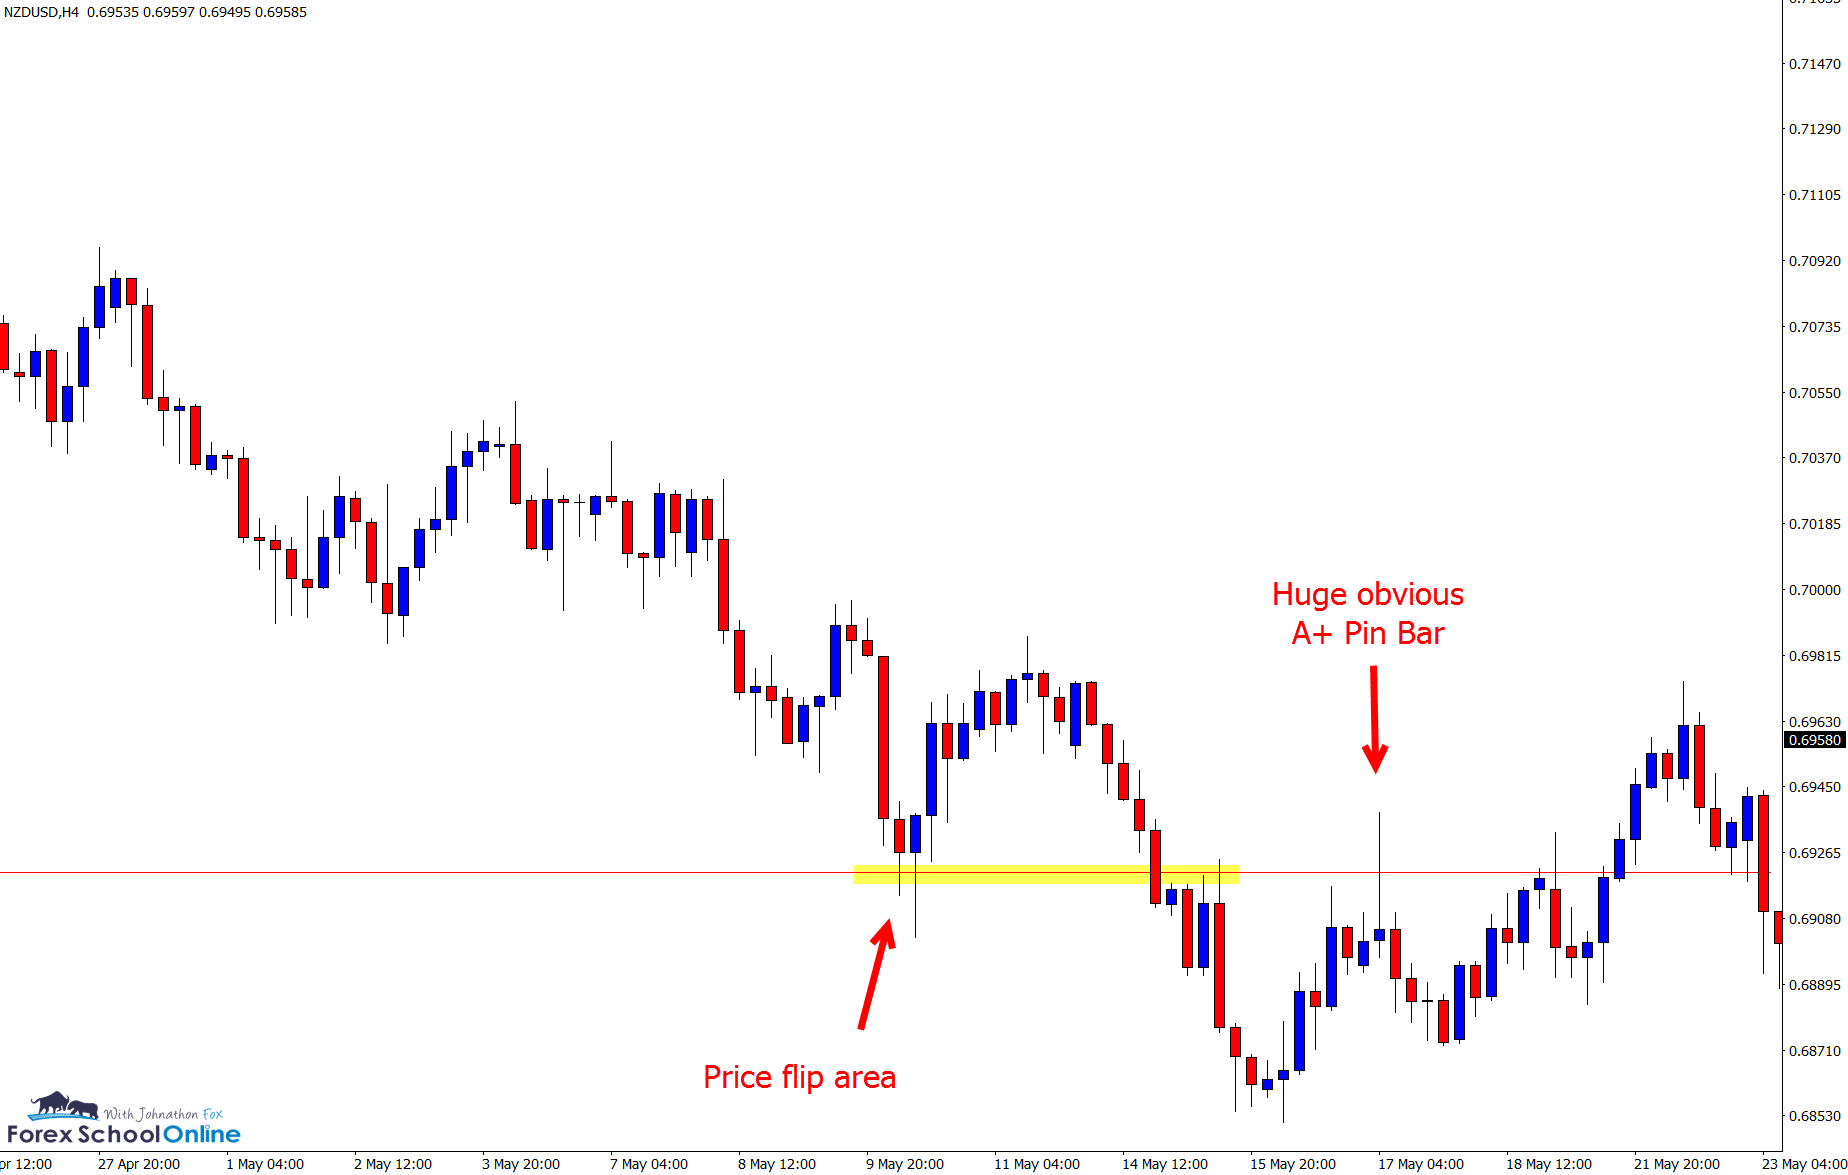
Whilst price broke out and continued on the move lower with the GBPUSD into the next support, price on the intraday charts of the NZDUSD moved back into the overhead price flip area to form an obvious pin bar reversal for potential short trades.
NZDUSD 4 Hour Chart
NZDUSD 8 Hour and 4 Hour Charts
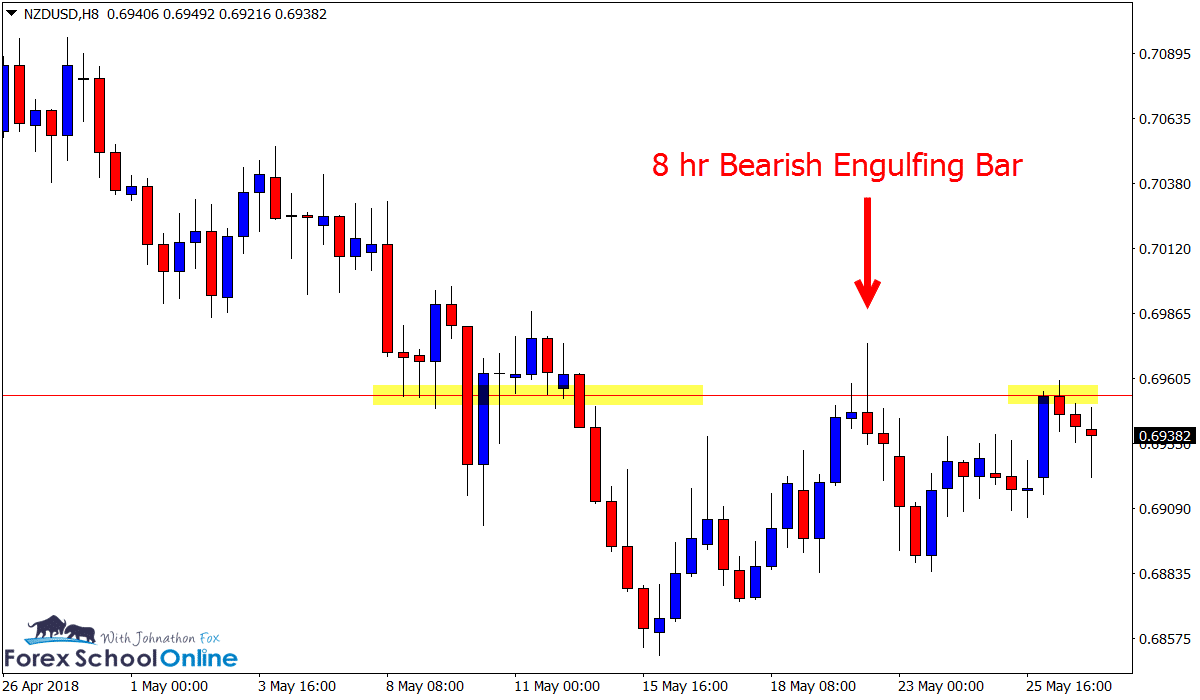
After a quick sell-off, price moved back higher and tested the daily resistance level, forming a false break and price action trigger.
Whilst the 4 hour chart showed a pretty solid 2 bar reversal, when combining the 2 candles together the chart created a solid 8 hour Bearish Engulfing Bar = BEEB.
NZDUSD 8 Hour Chart
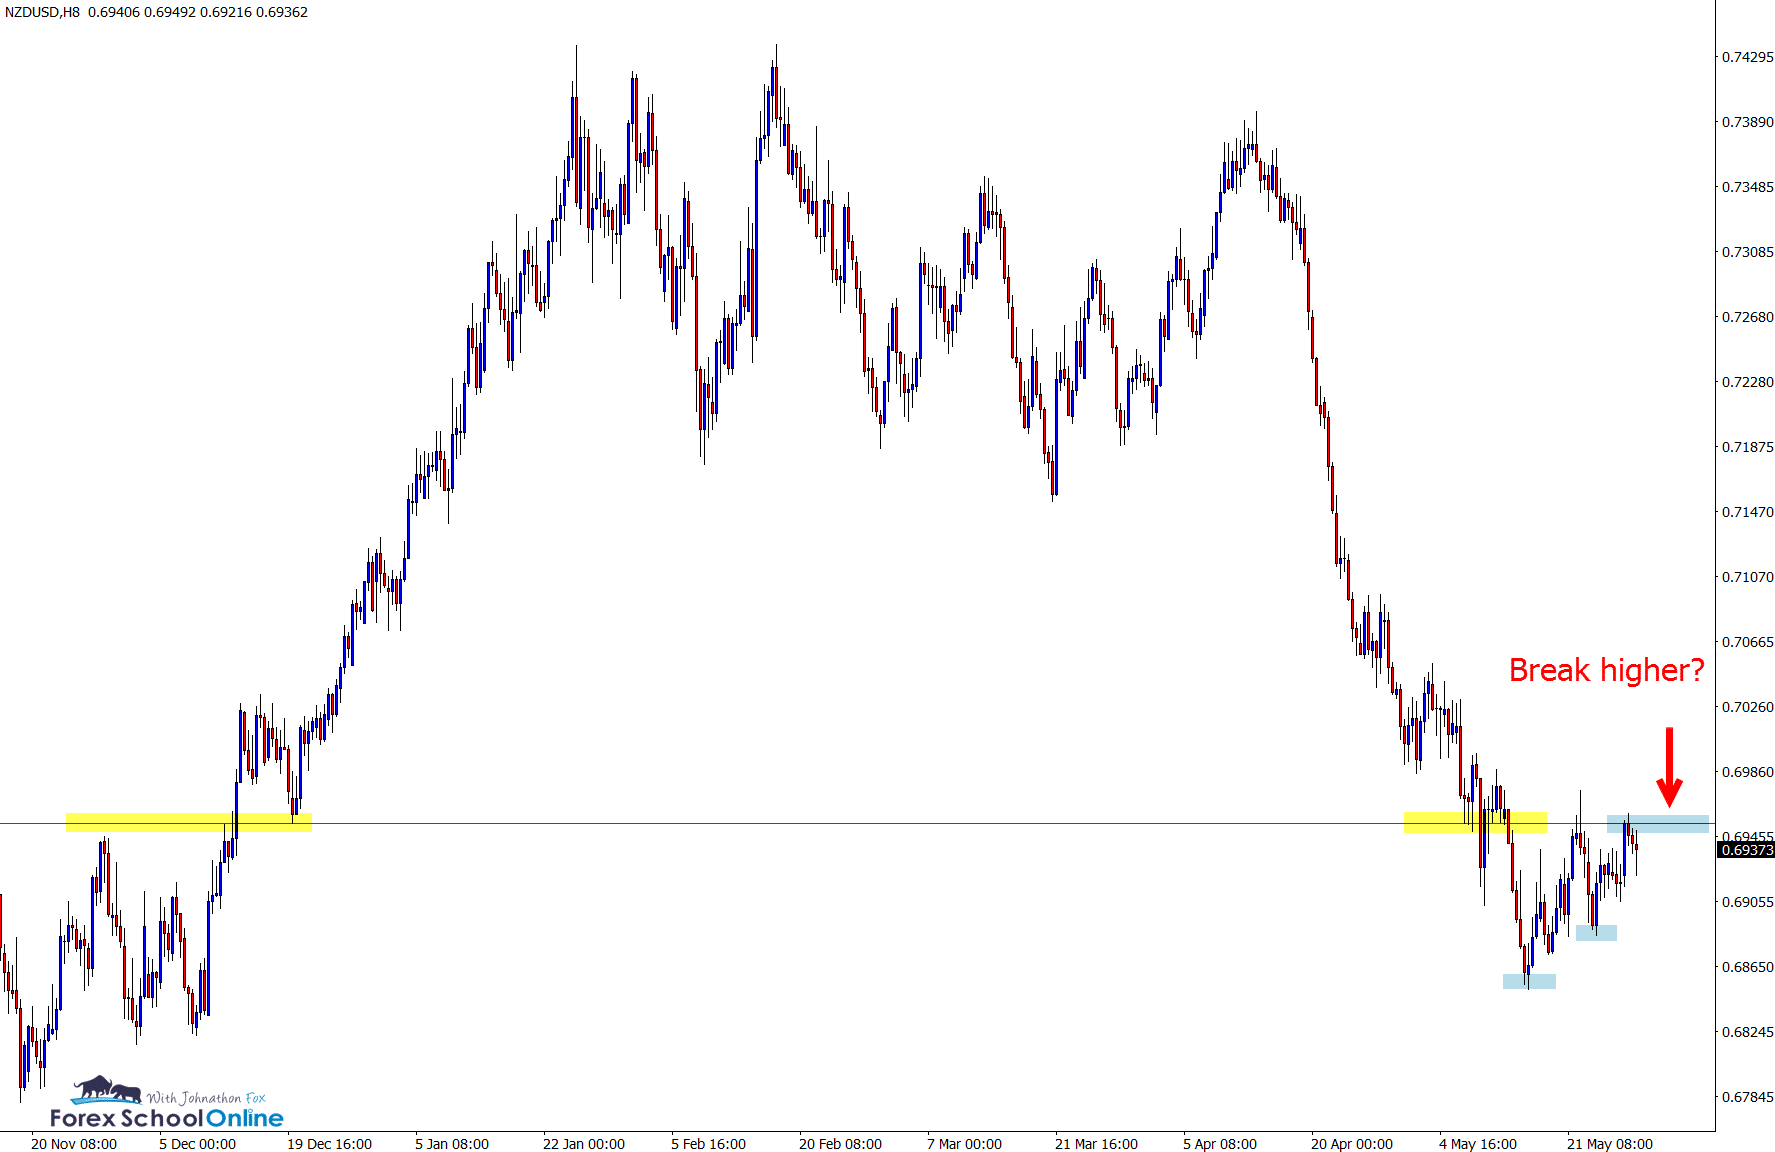
Price is now back and testing the same level, looking to potentially make a break higher after making a reversal pattern off the base lows.
If price can break higher and through this key level, there could be a potential to hunt long trades.
NZDUSD 8 Hour Chart
NOTE: Both of these setups (and the one below) show just how important marking price flips and major support and resistance are to setting up high probability trades.
EURUSD Daily Charts
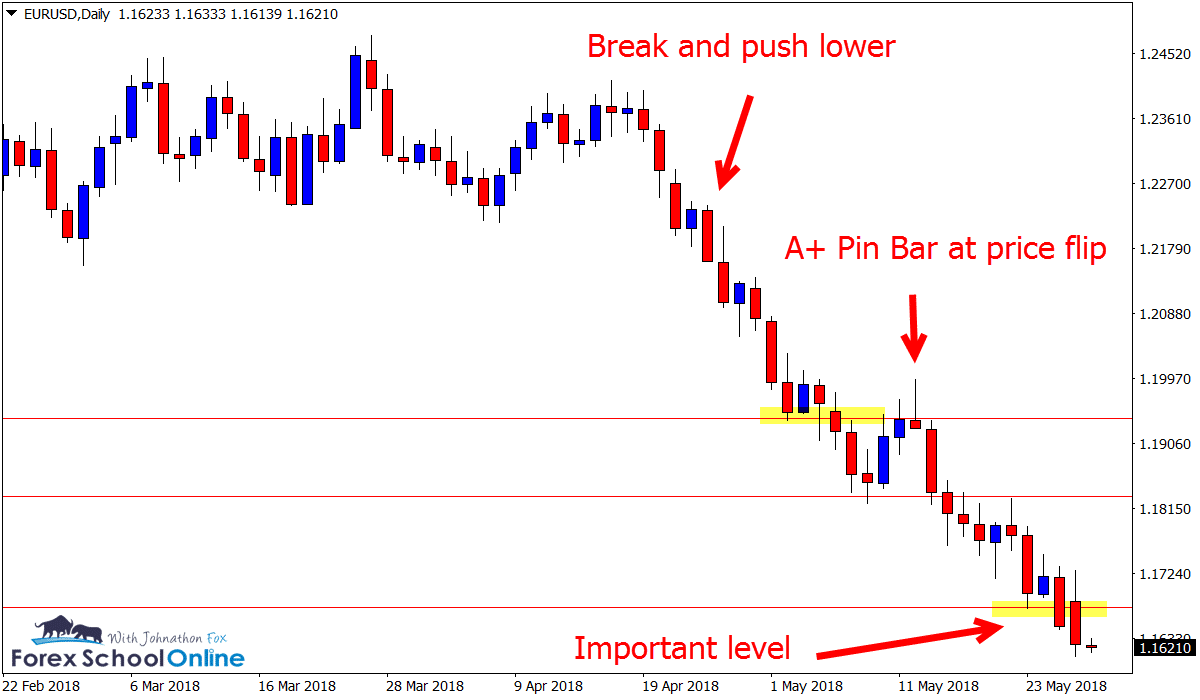
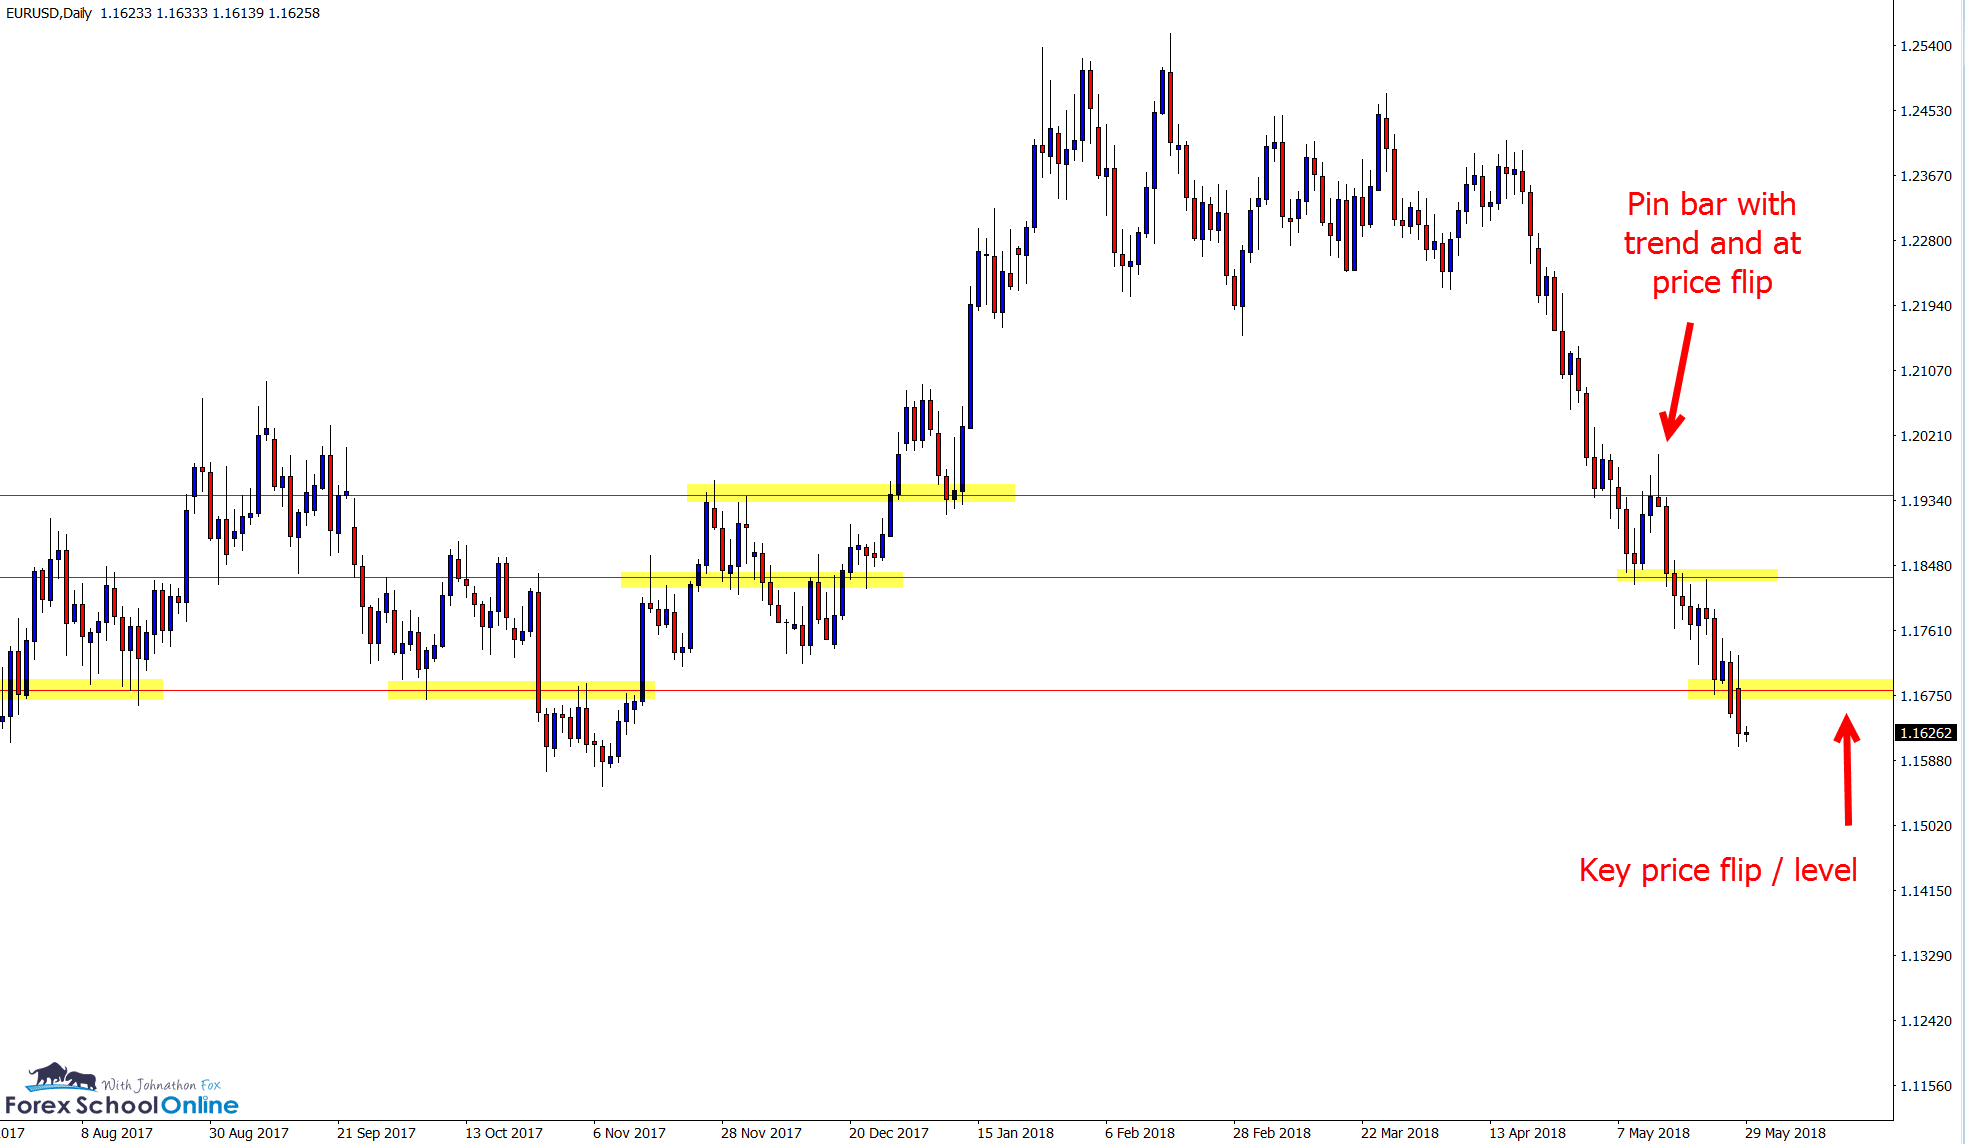
After breaking out and making a strong push lower, the only way most traders wanted to trade this market was lower with the momentum.
In these scenarios, any quick pull-back or retrace is a good opportunity to hunt for A+ trades to get with the next wave of momentum. That is what this pin bar gave traders with a simple price action trigger, inline with the momentum and at a swing point higher into a price flip (old support / new resistance).
EURUSD Daily Chart
Price has now broken two levels and as this is being posted, price is looking to break another important support level. If price breaks lower and through the support it is currently sitting on, there is a lot more space for a continued move to the downside.
EURUSD Daily Chart
8 Hour Chart Note:
- Want to create 8 hour time frames on your MT4 New York close charts (or any time frame you want)? Read the lesson and get the free indicator;
Change MT4 Time Frame Indicator
Related Lessons
Ultimate Guide to Marking Support and Resistance


Leave a Reply