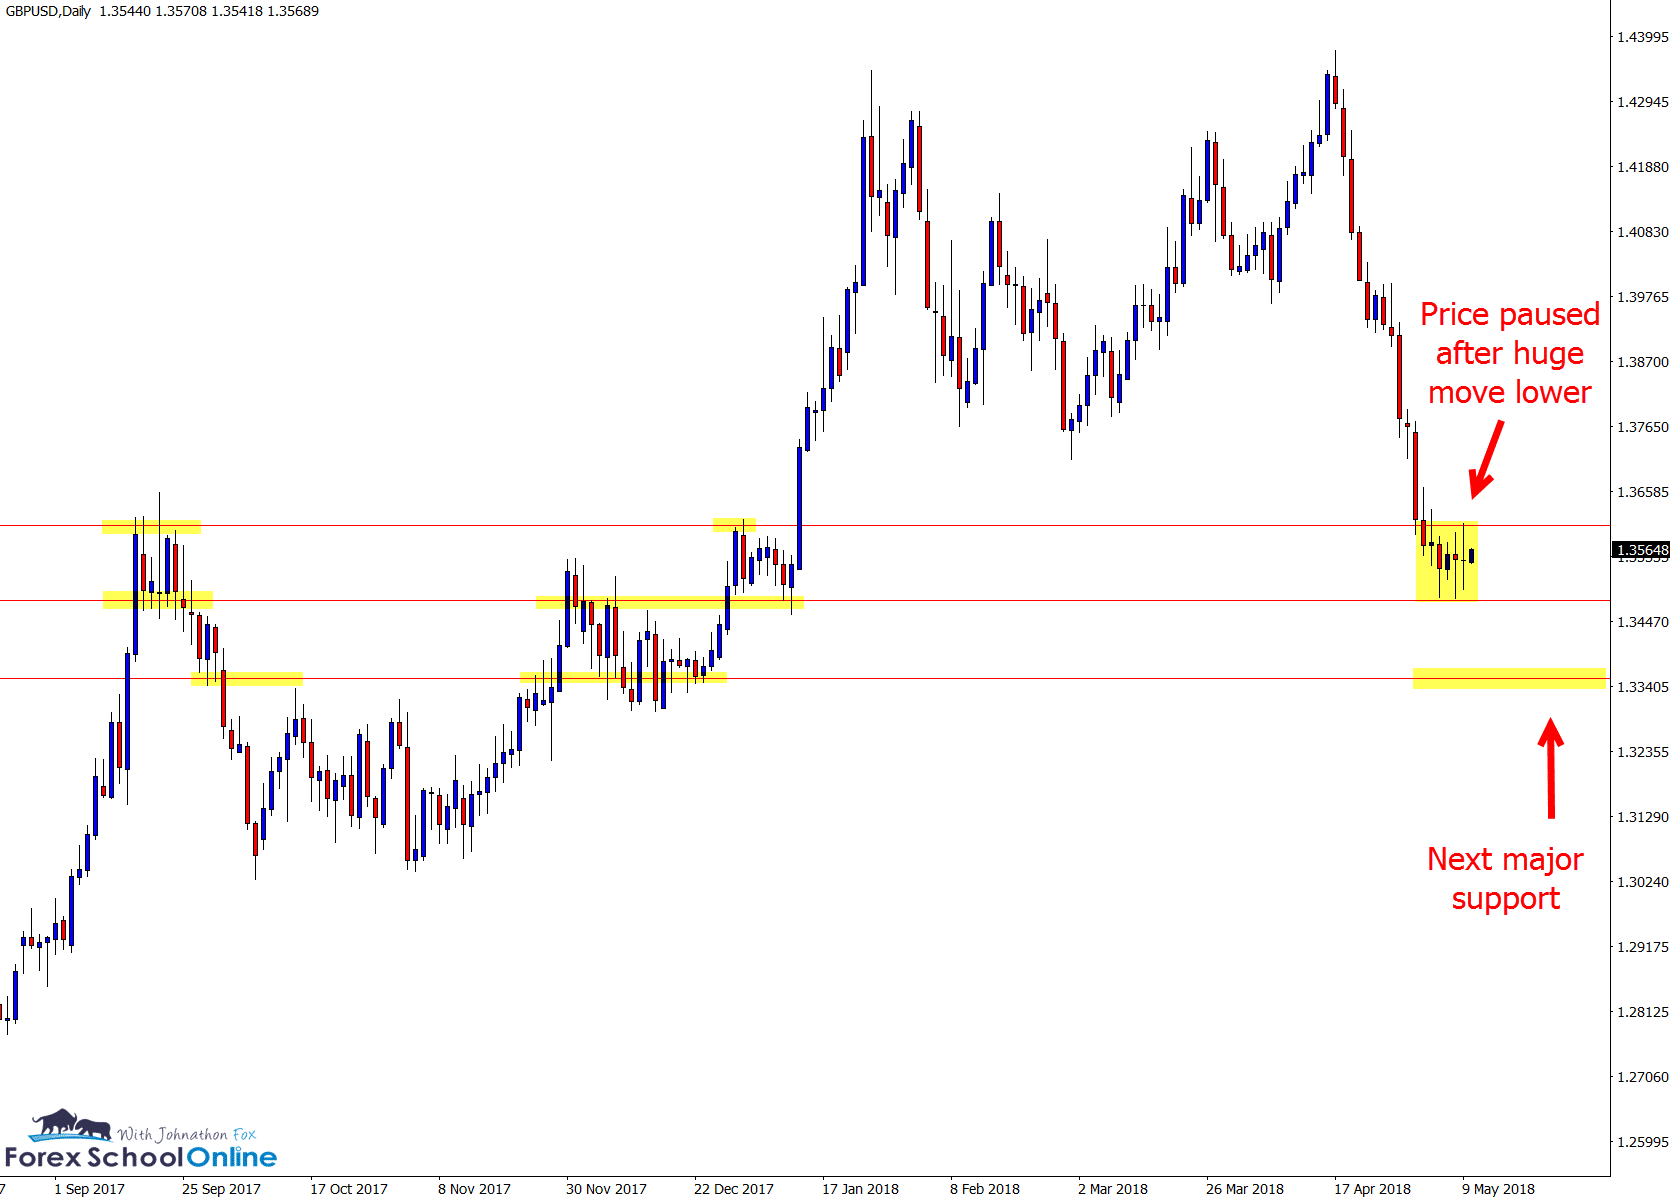
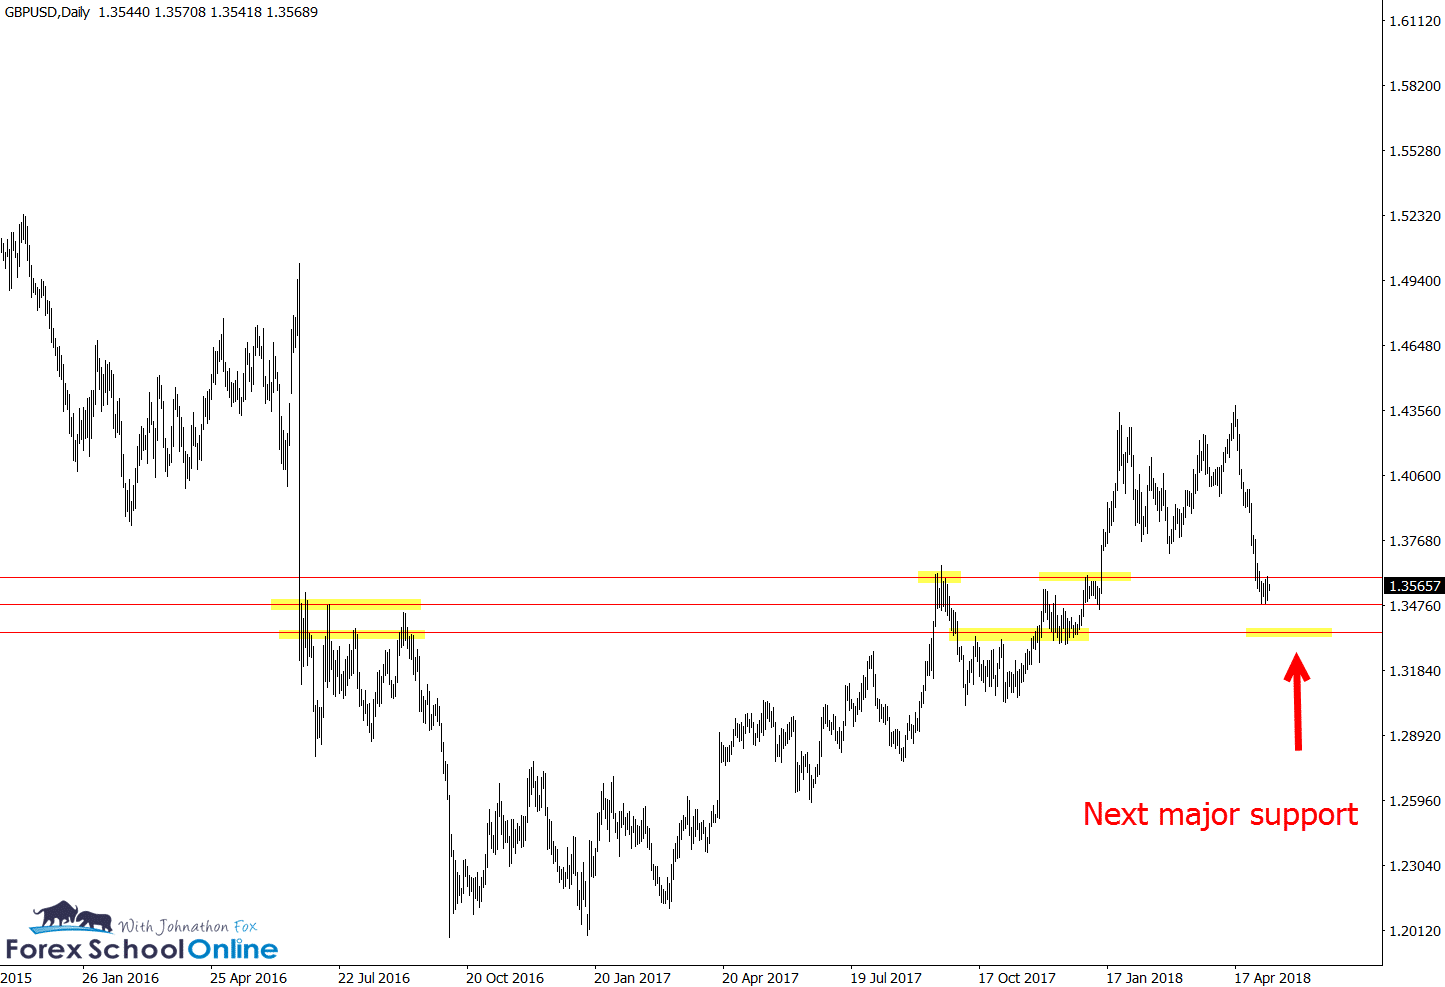
Both the GBPUSD and NZDUSD have been selling off strongly of late, with the GBPUSD now taking a pause and the NZDUSD making an intraday pull-back higher into a potential flip area.
GBPUSD Daily Price Action
After making an extended run higher, price on the daily price action chart of the GBPUSD has turned on it’s heels quickly and aggressively.
Price is now making it’s first real pause after this huge drop lower and has moved into consolidation.
In the lesson below I discuss the consolidation and continuation patterns and how price will always at some point move into a pause phase.
Lesson: Key Price Action Market Rules
Often this pause and consolidation (sideways move) comes after a large move, just like this one and occurs because traders are looking to cash out after a large push.
Price can then often continue in the same direction it was travelling in once the orders are cleared, and the move that had already started continues.
GBPUSD Daily Chart

GBPUSD Daily Chart

NZDUSD 4 Hour and 1 Hour Price Action
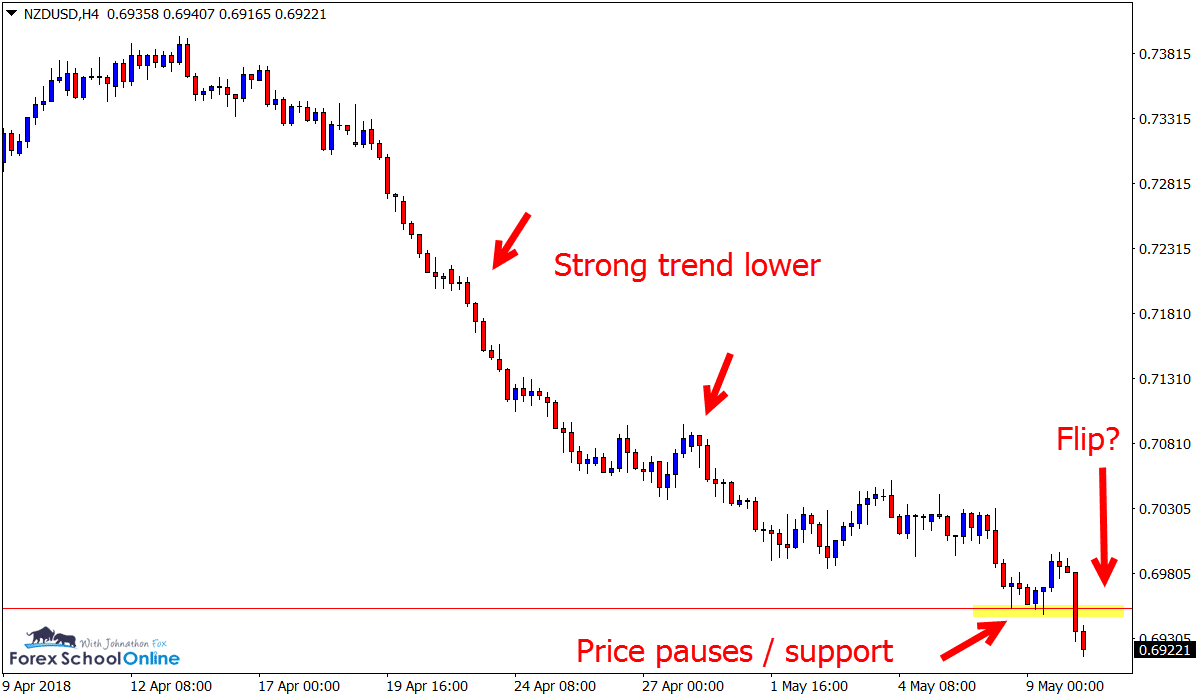
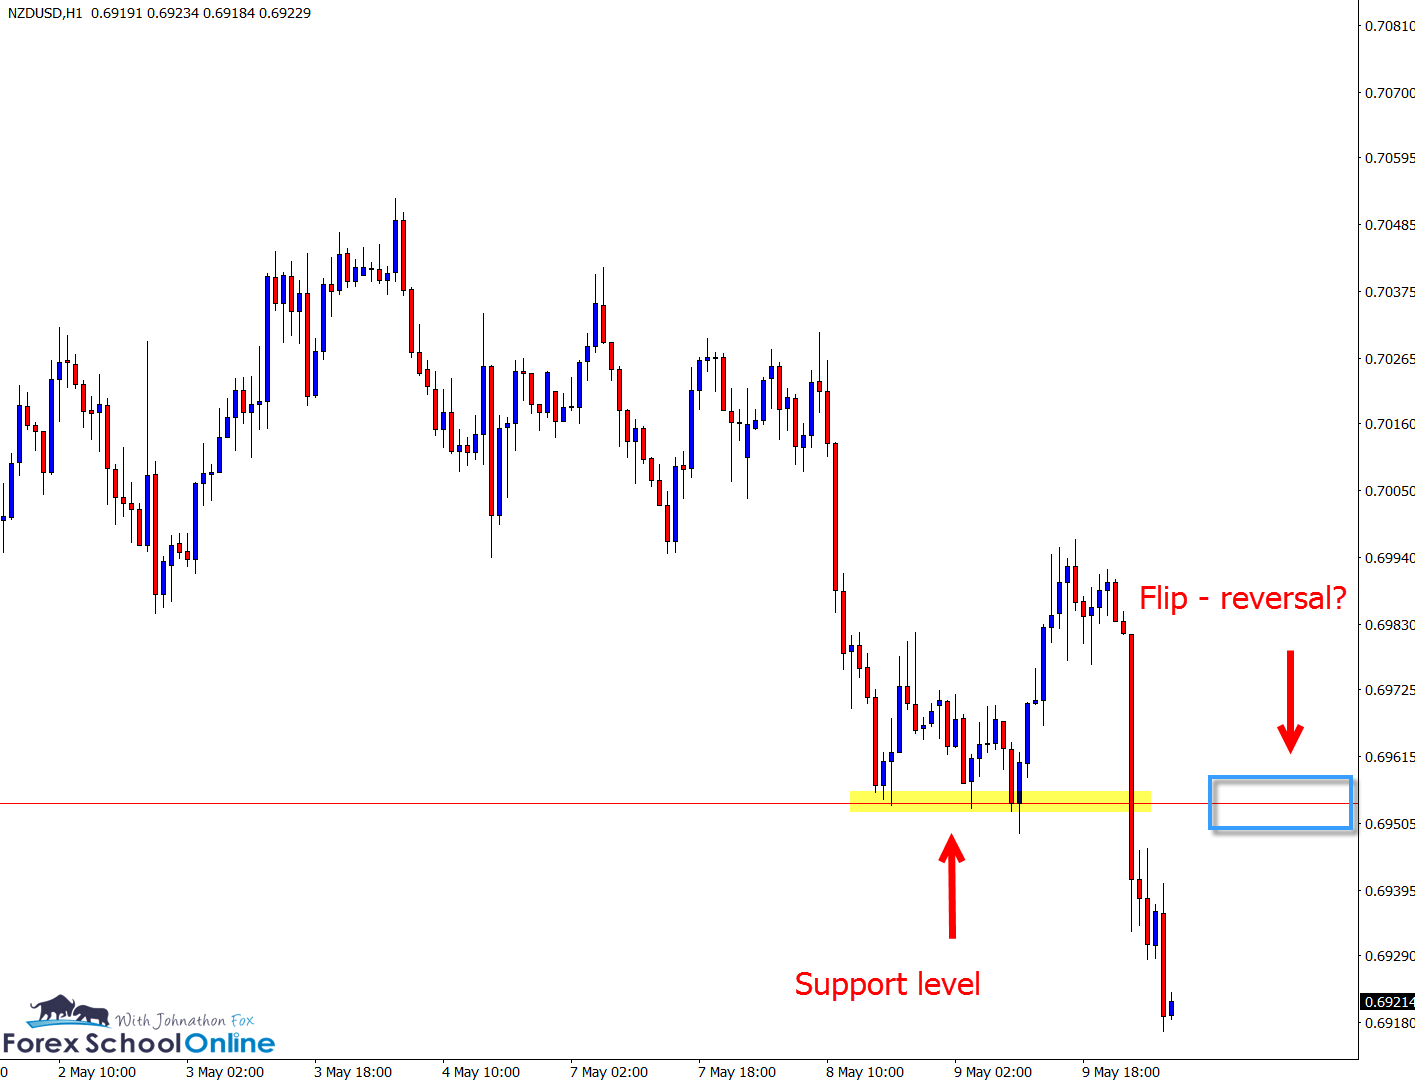
The NZDUSD move lower is best illustrated on the intraday 4 hour and 1 hour charts.
If you have a look at your daily chart of the NZDUSD you will also find this same level that is marked below being respected back to the left.
The 4 hour chart shows a typical price action trend, with lower highs and lower lows, and price consolidating and then continuing.
Price has now just broken and moved lower again and the support level it has broken through could act as an important level to keep an eye on should price make a pull-back higher to test as a new resistance level.
You can read about how to use this strategy in the lesson First test of support or resistance strategy lesson
NZDUSD 4 Hour Chart

NZDUSD 1 Hour Chart


Leave a Reply