Charts in Focus – Trade Ideas – 3rd October
Markets Discussed Today: AUDCHF, NZDUSD, GBPJPY & BITCOIN v USD.
Note: We Use Correct ‘New York Close 5 Day Charts’ – Download Free New York Close Charts Here
AUDCHF DAILY CHART
Market Reversal From Base Low
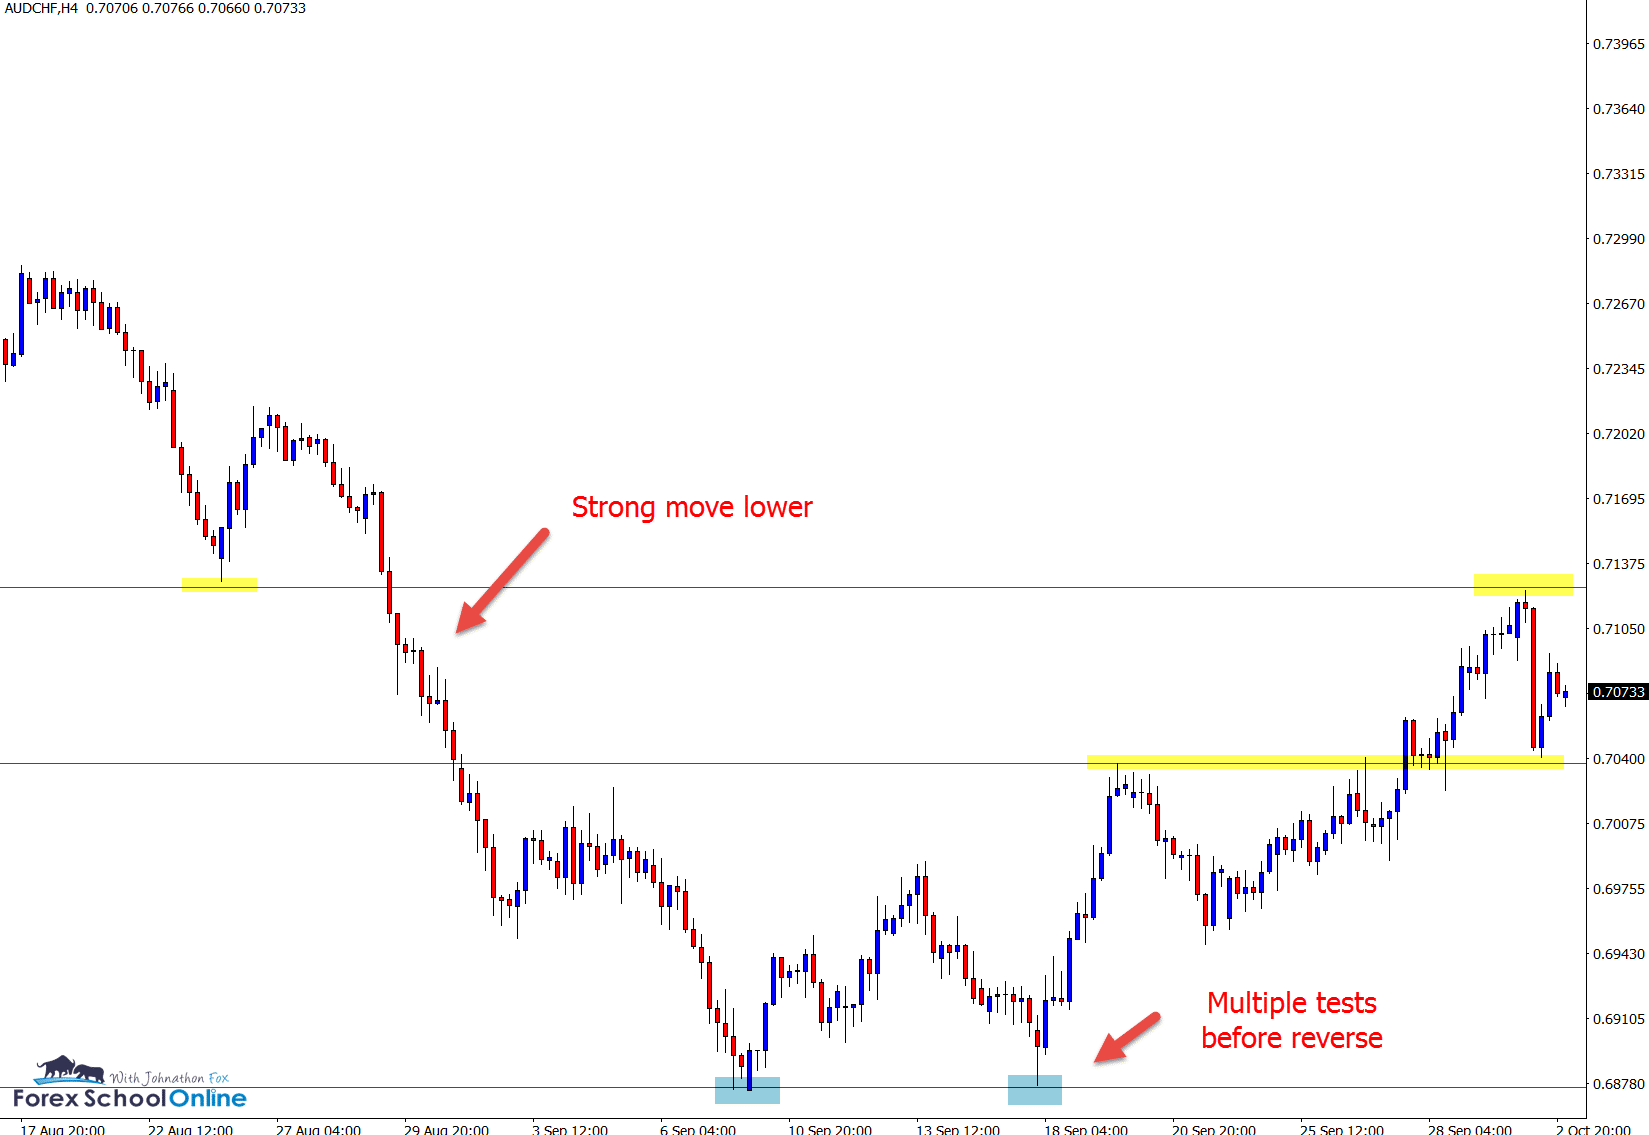
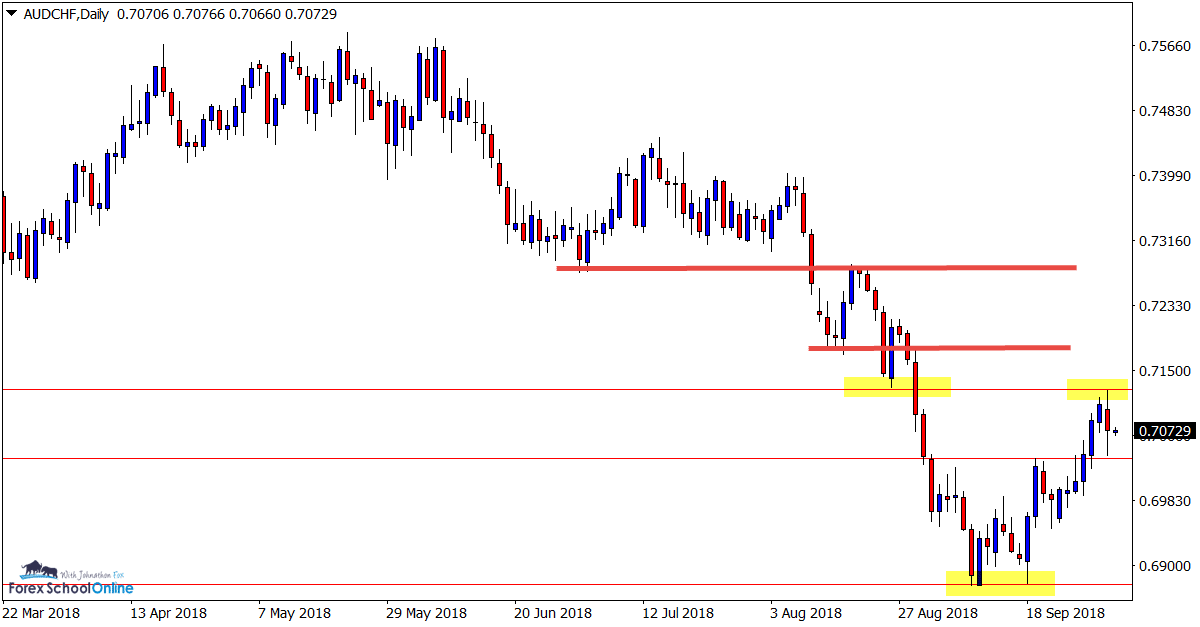
Price action on the AUDCHF has rebounded higher in the past two weeks after making a heavy move lower since June of this year.
After breaking the 0.7275 area that had been a major support and proven flip level going back many years, price quickly slammed lower.
In the past two weeks we have seen an upturn as the charts below show;
As we discussed in the lesson ‘How Price Action Forms Market Reversals’ price tested the support lows on the daily chart twice before making the reversal back higher.
This is very common after we have seen a large move higher or lower. Price will form a high or base at the low and make multiple tests to build momentum back in the other direction.
Daily Chart
4 Hour Chart
NZDUSD DAILY CHART
Potential Breakout
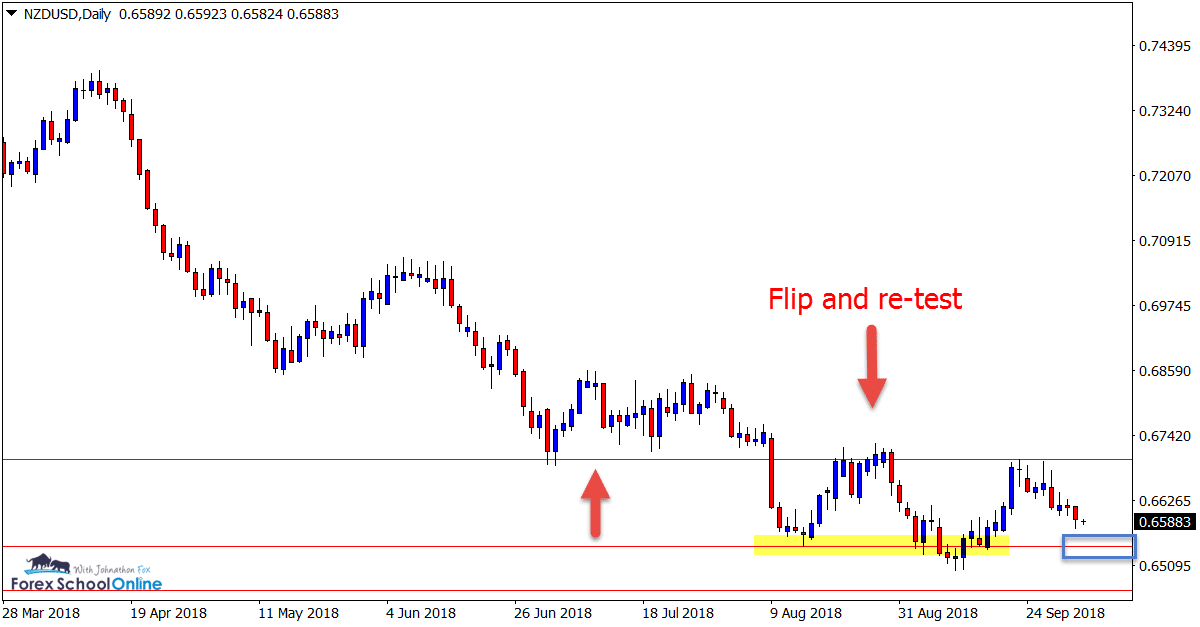
Price on the NZDUSD daily chart has been trading sideways in recent times after being in a solid trend lower.
Whilst tight consolidation boxes such as these can be very tricky to trade until price breaks out, once price does make a break they can open up a lot of trading opportunities.
If price can break lower and inline with the move it had been making, then it could open the way for breakouts and quick breakout & re-test trade setups.
Lesson: How to Use First Test Support / Resistance Strategy
Daily Chart
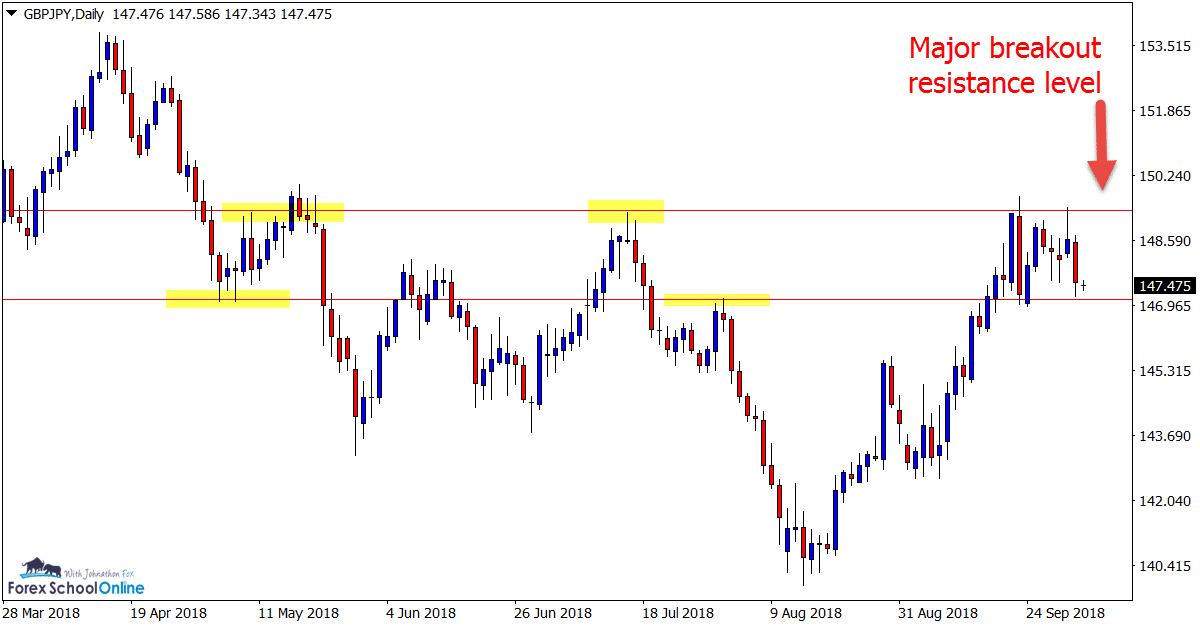
GBPJPY DAILY CHART
Can Price Move Higher and Test Again?
Whilst at first glance this chart looks a bit sideways and messy, with a closer look we can see that if price can breakout it could move into a lot more space.
The overhead resistance has been tested multiple times and is yet to break, but this could be a level to watch if price can move higher and make another push to break through.
Potential trade setups could open to get long with a strong close above this major resistance.
Daily Chart
BITCOIN V USD DAILY CHART
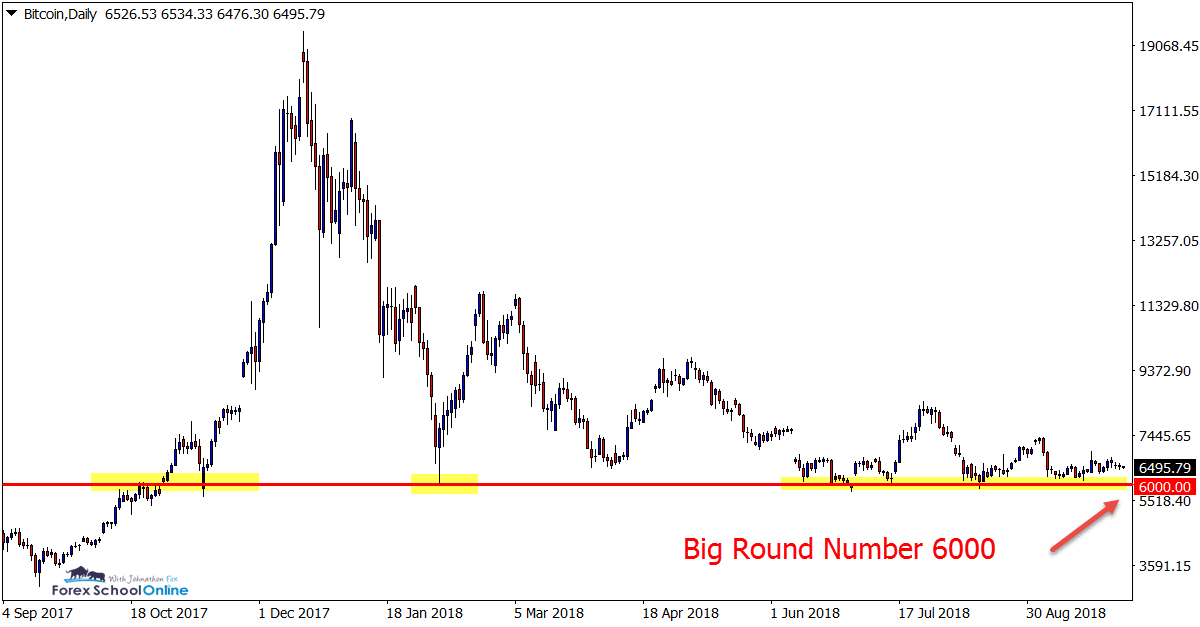
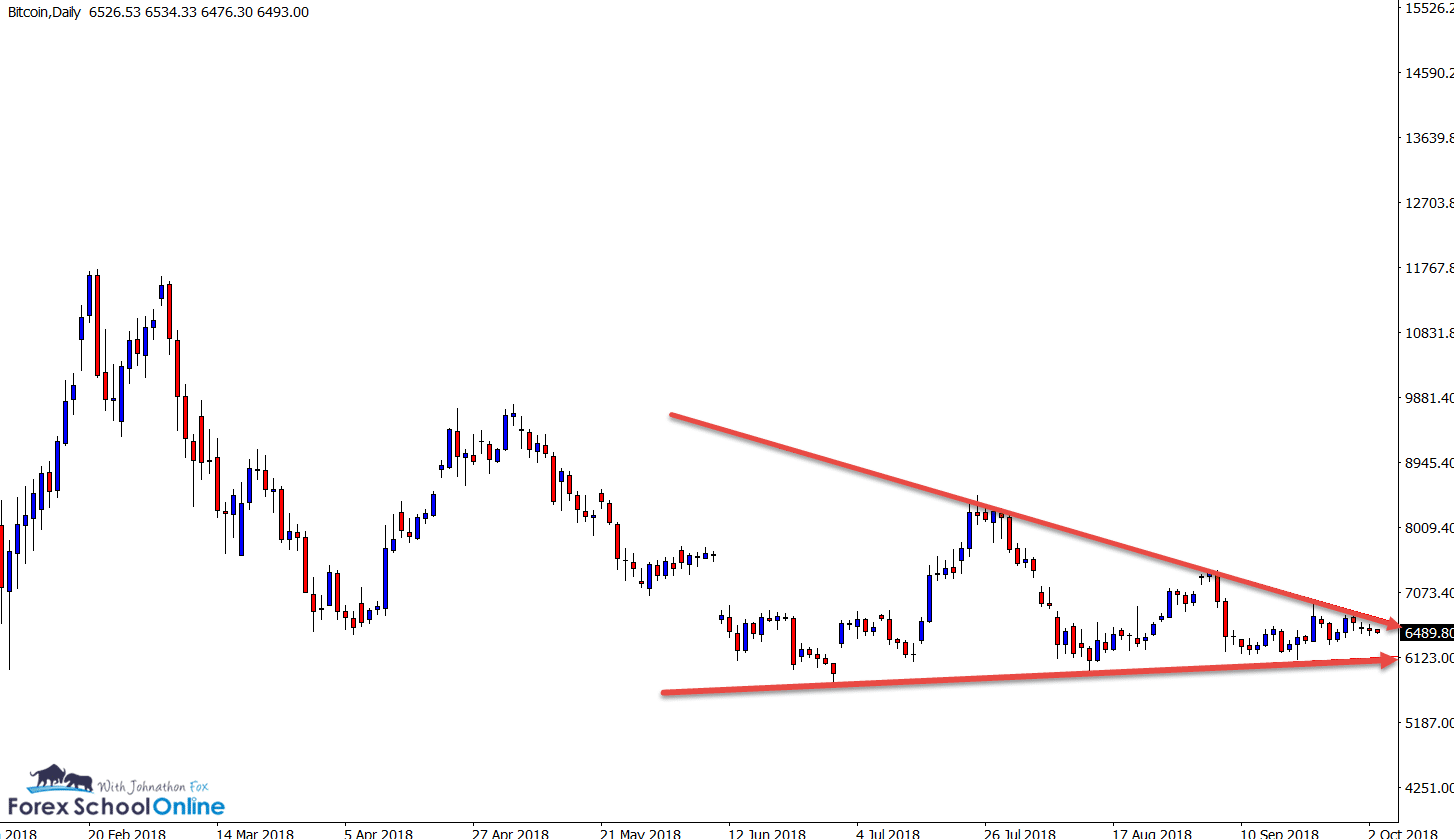
6000 Level Looks Crucial
I don’t often discuss the BITCOIN market, but it is a chart I keep a close eye on.
You will notice on the chart below I have added arrows. These are for illustration purposes only to explain the price action and are not trend lines.
I do not use trend lines as they are too subjective and they can quickly become something that a trader can get carried away with and start seeing everywhere when they are not.
Major daily support and resistance levels are obvious, but trend lines will often be different depending on the trader looking at the chart.
With that said; a few interesting things about this market;
- The daily range is 1/10th of what it was at its peak. In other words; volatility is well down.
- As the arrows highlight; price is winding up tighter and tighter into a very small trading range.
- The 6000 Round Number is holding at the moment, but looks to be key.
As I have discussed in the past charts in focus summaries and you can read at; BITCOIN v USD the Big Round Number of 6000 looks to be key.
This was a key level at the start of the year and it has gone onto test it another four times. If this breaks we could see a quick move lower into the next support lows.
Daily Chart
Daily Chart
Charts in Focus Note: All views, discussions and posts in the ‘charts in focus’ are the view of Forex School Online and are not recommendations or trading advice. All posts are general in nature and are not advice to buy or sell.
Please leave questions or comments in the comments section below;


Leave a Reply