Weekly Price Action Charts in Focus – Aug 27th 2018
Note: We Use Correct ‘New York Close 5 Day Charts’ – Download Free New York Close Charts Here
EURAUD DAILY CHART
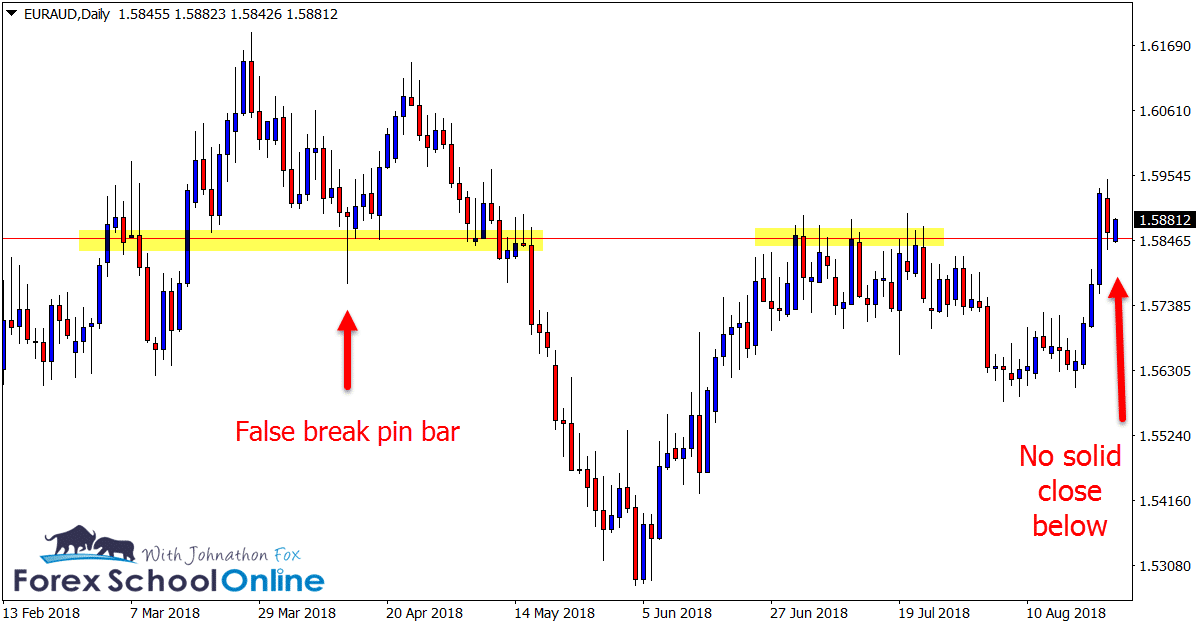
Price Fails to Close Above Major Support
Price action on the EURAUD daily chart has recently smashed higher and through a major resistance level.
At the time of writing, price is making a major test of the old resistance and new support price flip level after not being able to close below it.
Watching to see if price has either closed above or below a major level can give us a huge clue to where and what price is looking to do.
In this case we can see price has made an attempt to break back lower and through the old resistance and new support price flip, but it is continuing to hold as a new support and price flip.
This works the same way for individual candles and the strength they close with. For example; how strong or weak an engulfing bar closes tells us a lot about the strength of the candle / trigger.
AUDCHF DAILY & 4 HOUR CHARTS
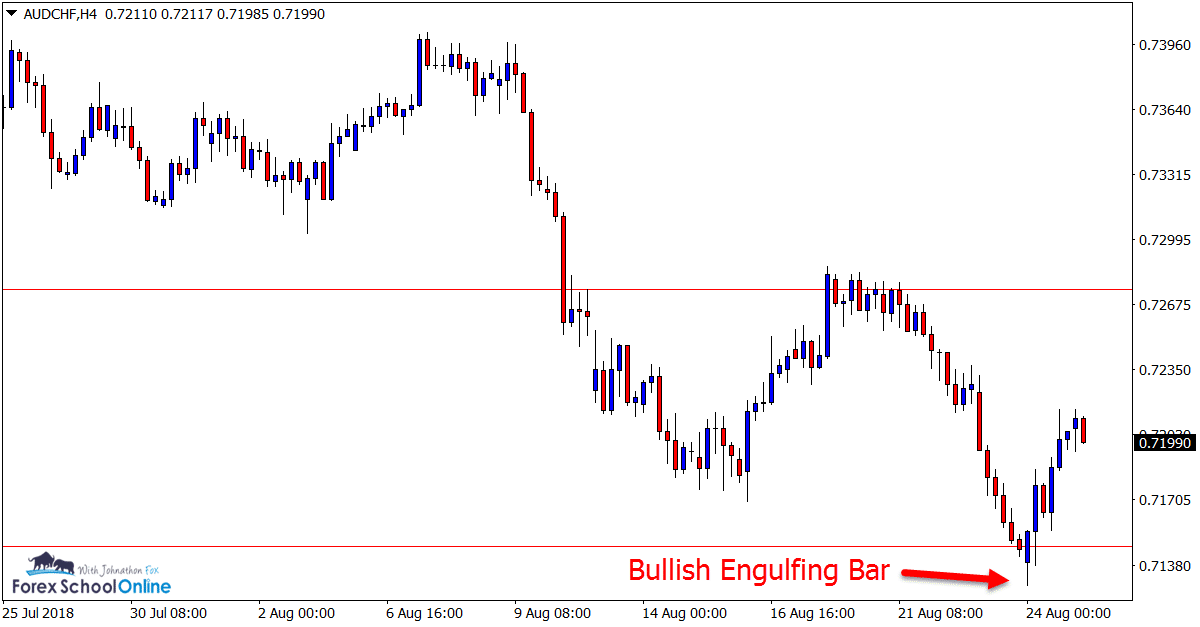
Major Test and BUEB
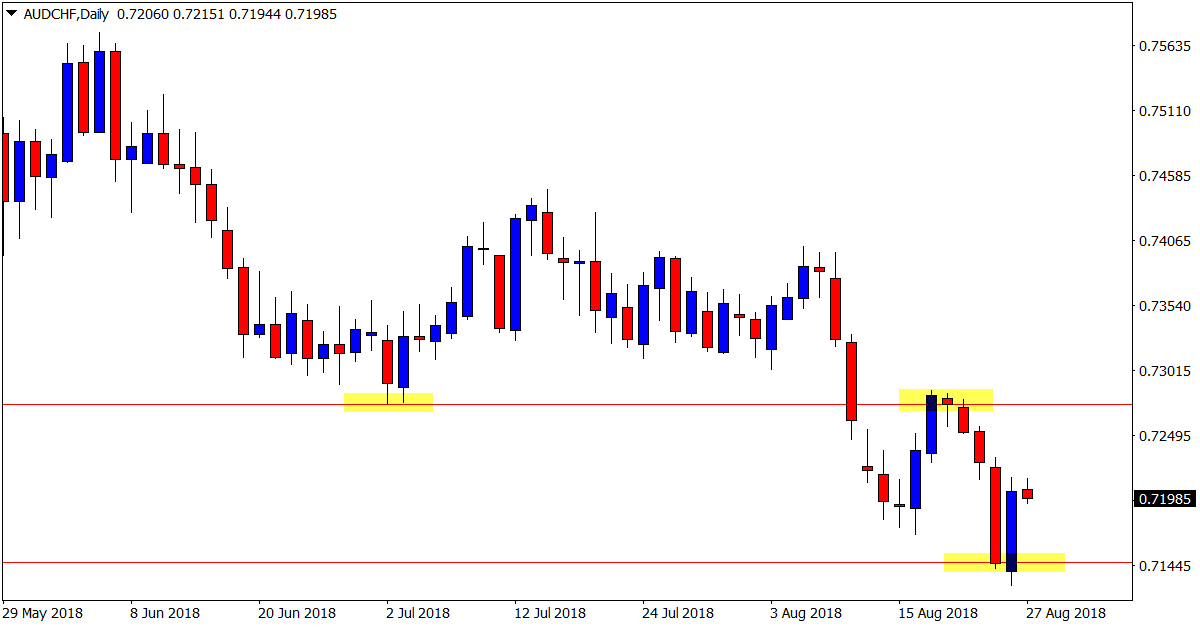
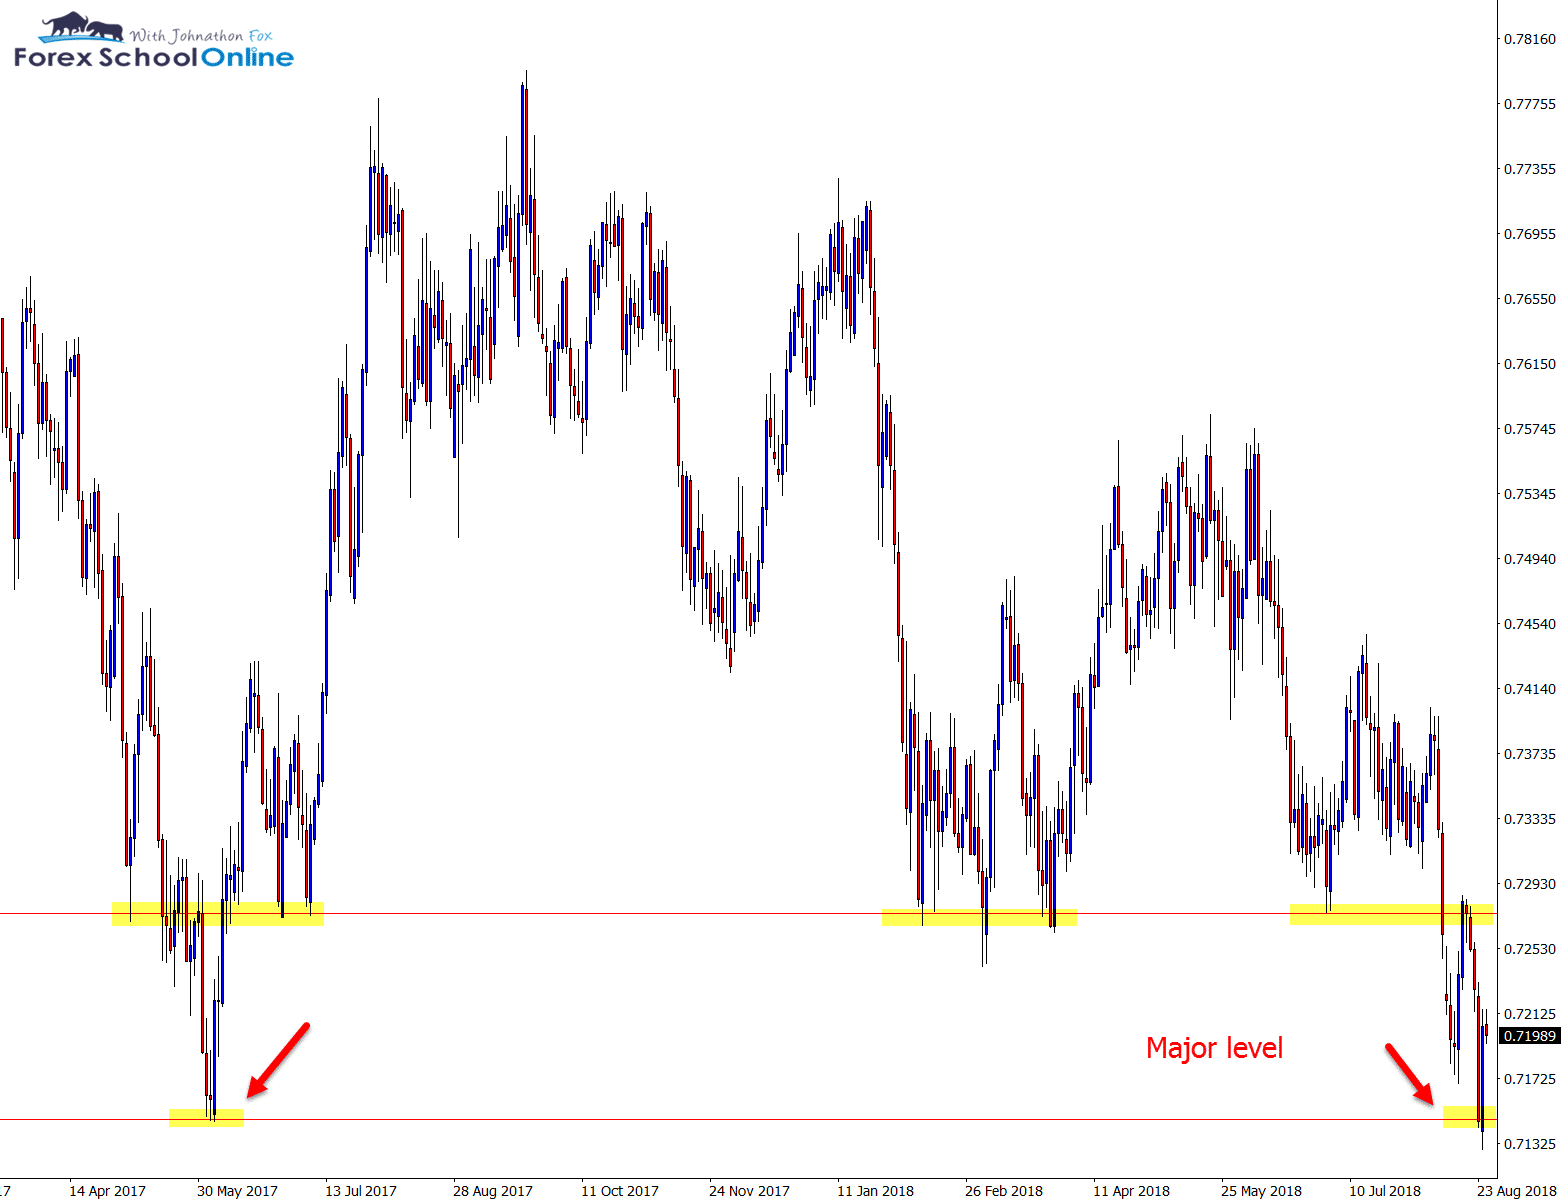
Whilst all the momentum had been lower in recent times on the AUDCHF, we can see that price has run into a major support level.
As shown on the zoomed out daily chart below; this level was a proven previous support and price was making a re-test. One of the trickiest parts for traders is knowing when to make trades with the trend, in a range and against the trend.
When making trades against a strong move or momentum we always need to see a lot of ticks in the box and a lot of confirmation. In other words; trades against the trend need to have a lot in their favor to make them worth the risk, including the potential reward.
The 4 hour chart shows a clear Bullish Engulfing Bar = BUEB rejecting the major daily chart level that had a lot of space to move back higher into.
EURGBP DAILY CHART
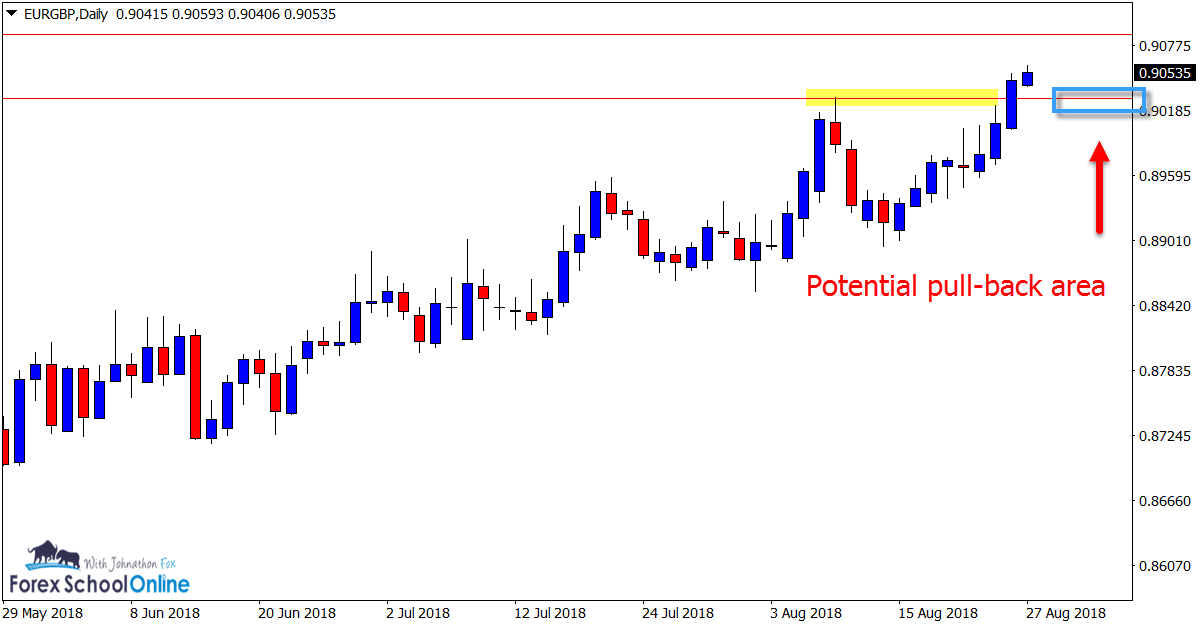
Strong Trend Higher With Potential Retrace
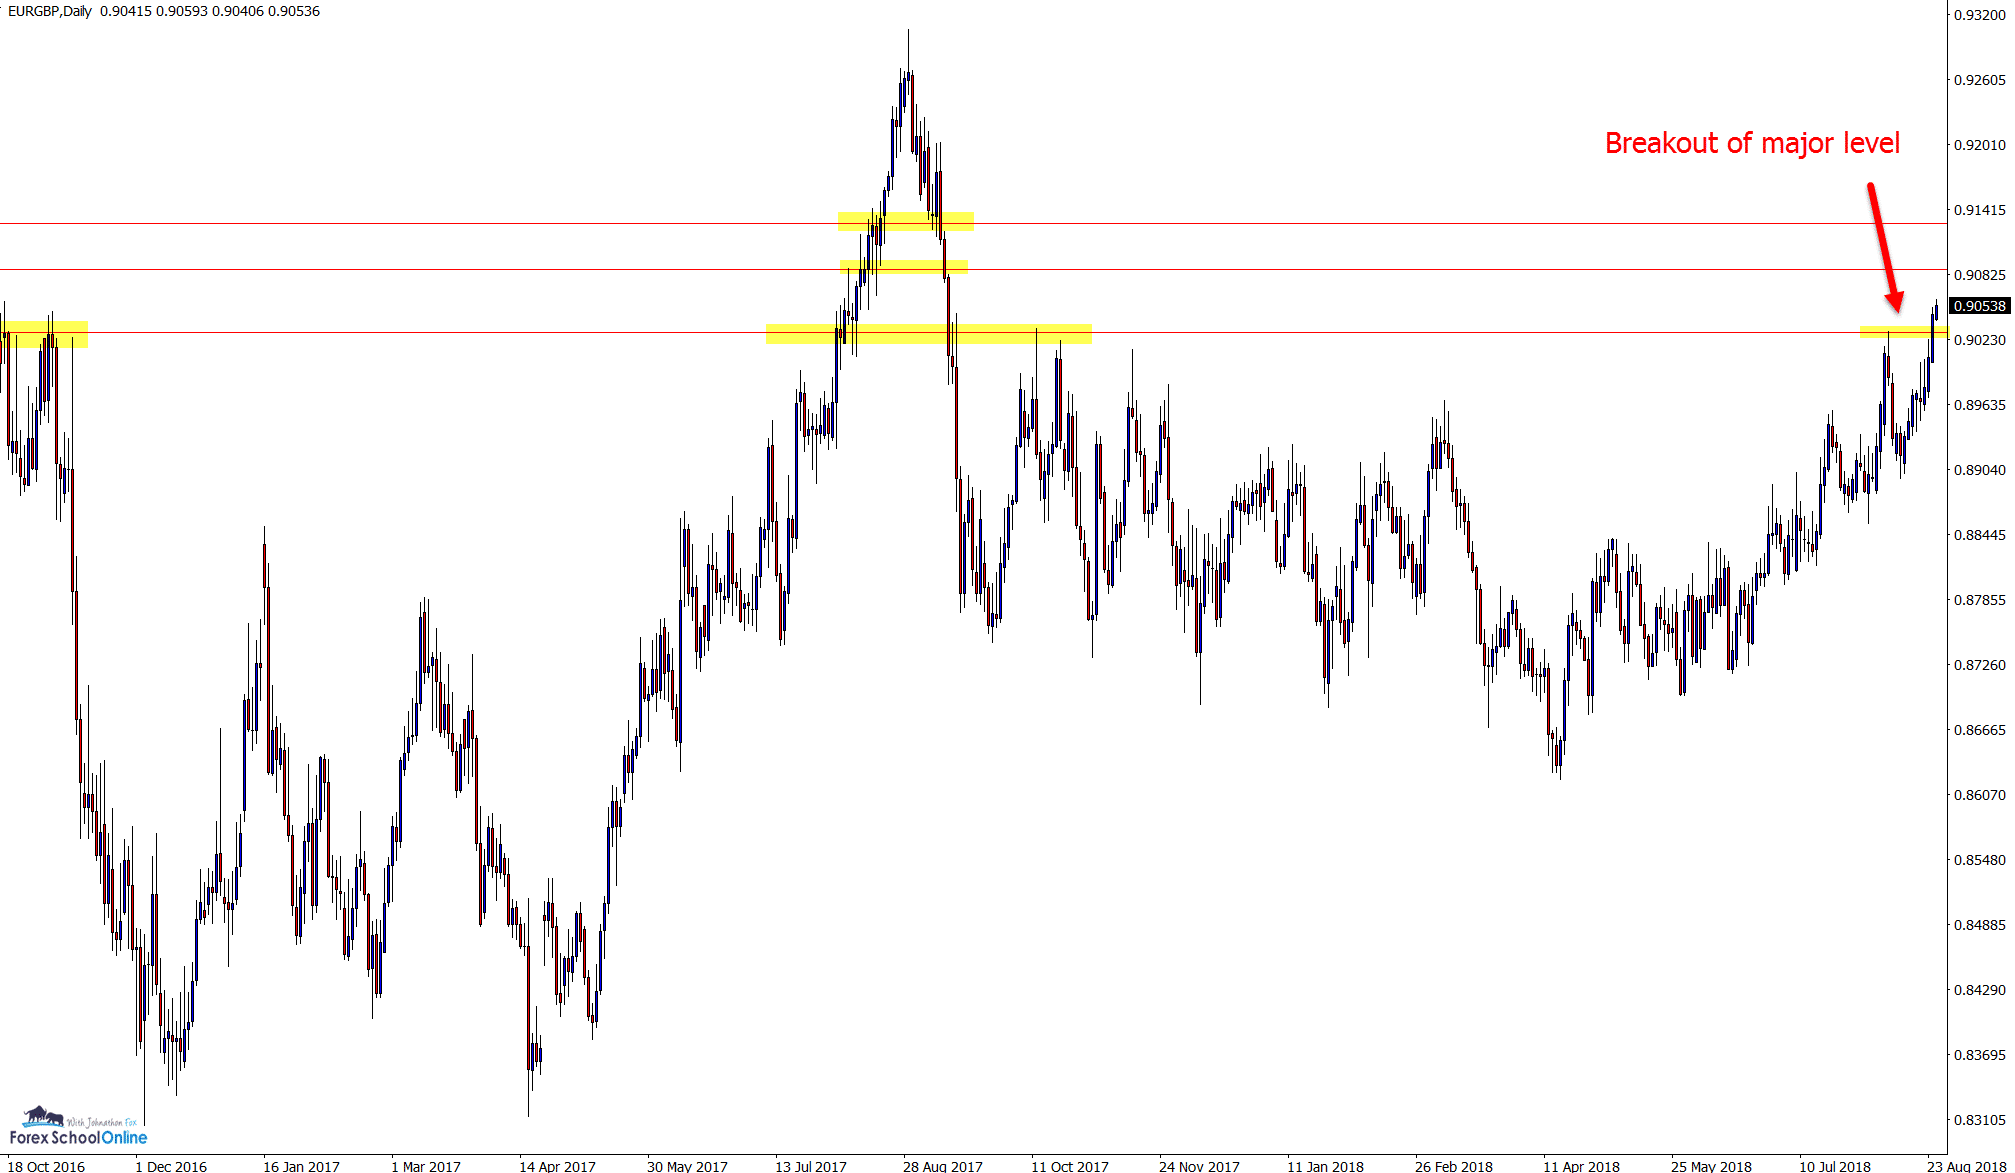
Price on the EURGBP daily chart has been making consistent higher highs and higher lows in a clear price action trend higher.
Continuing on this trend, price broke the recent swing high and resistance level and moved further higher.
This daily level could present as an area to look for price to rotate back into and a level for price to potentially hold as old resistance and new support. Smaller time frames such as the 4 hour or 1 hour charts could tip traders off as to whether this level is holding and looking to fire of a bullish reversals signal.
GOLD v USD DAILY CHART
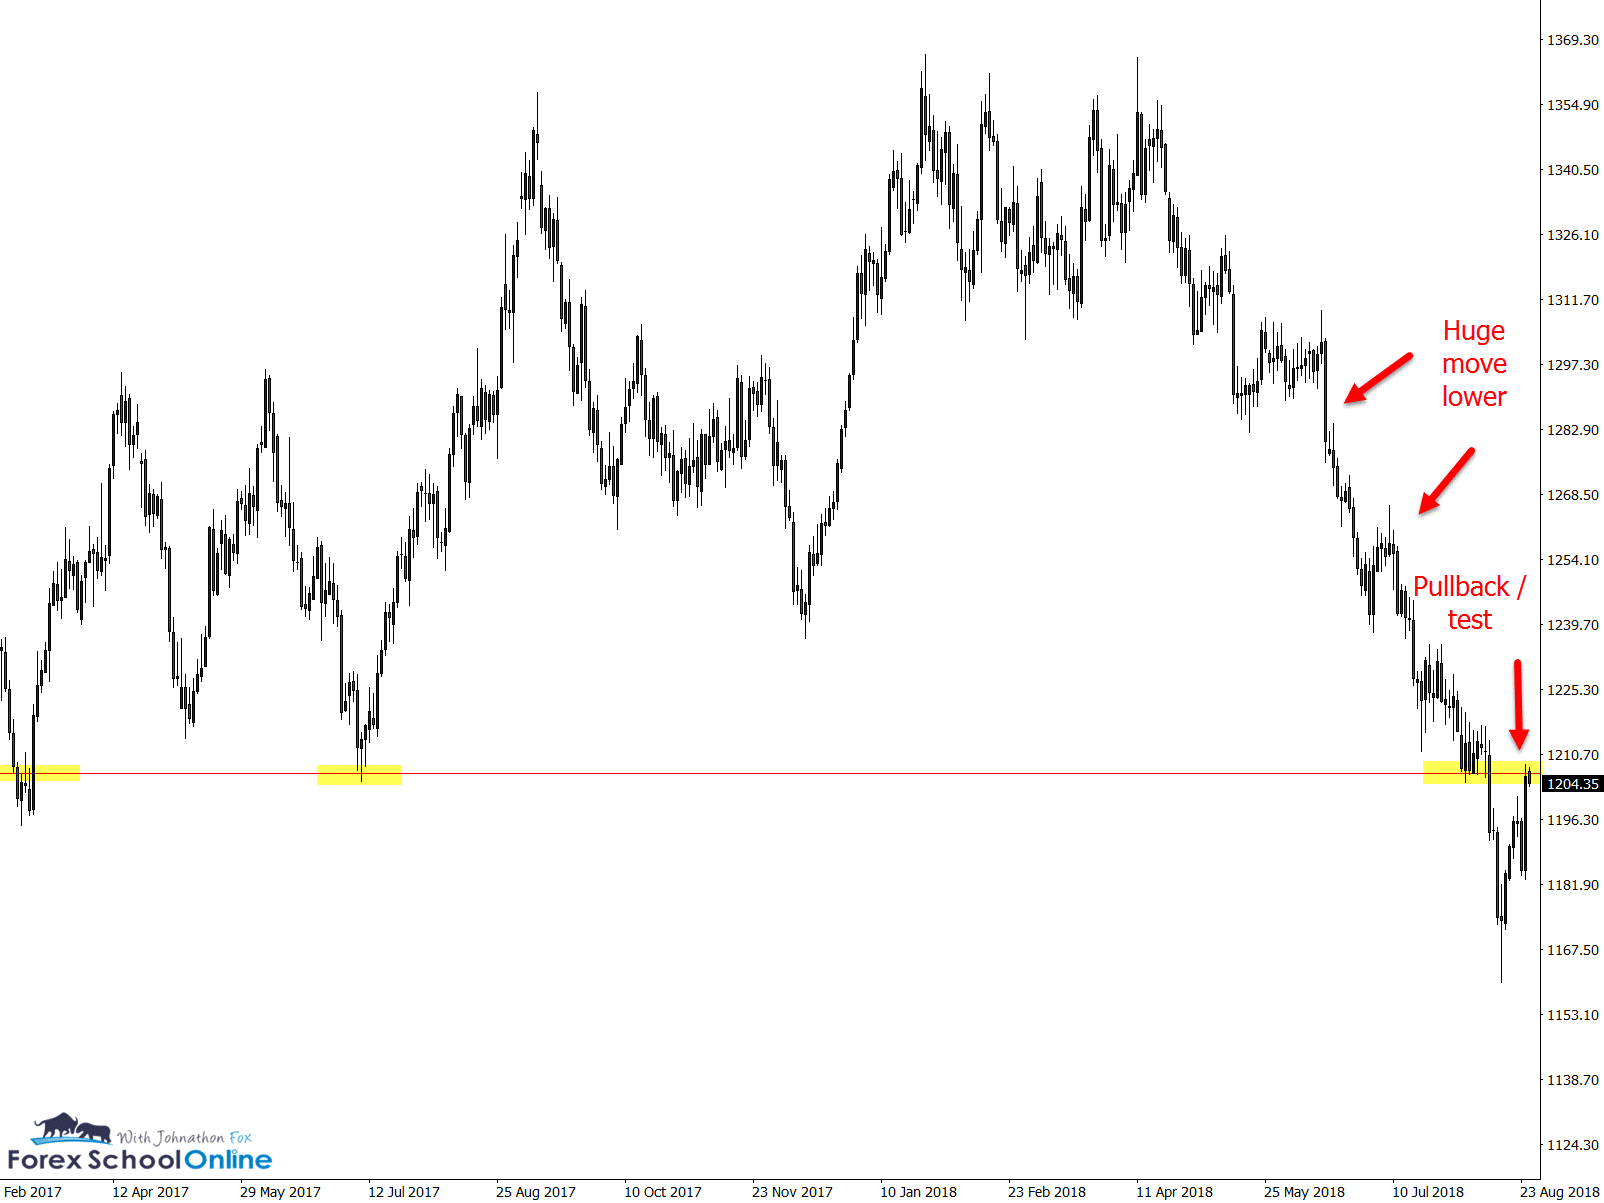
Huge Move Lower With Price Rotating Back Higher
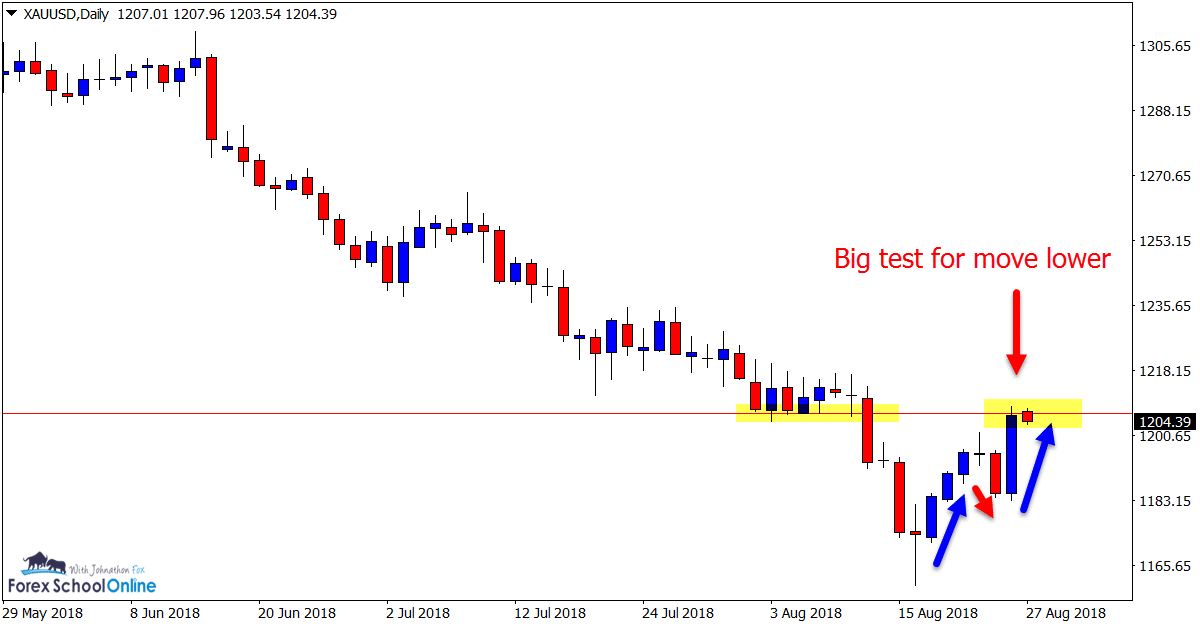
In recent times price on the Gold v USD chart has been smashed lower with rotations back higher into value only to sell back lower.
Price has now made another rotation back higher and into the overhead resistance level.
This is an interesting test to watch over the coming sessions as price has not just rotated back straight higher, but formed a mini base pattern showing the bulls / buyers are trying to attempt a resurgence.
This level could prove critical.
Charts in Focus Note: All views, discussions and posts in the ‘charts in focus’ are the view of Forex School Online and are not recommendations or trading advice. All posts are general in nature and are not advice to buy or sell.


Leave a Reply