AUDUSD Caught in Wind-Up on Daily Chart
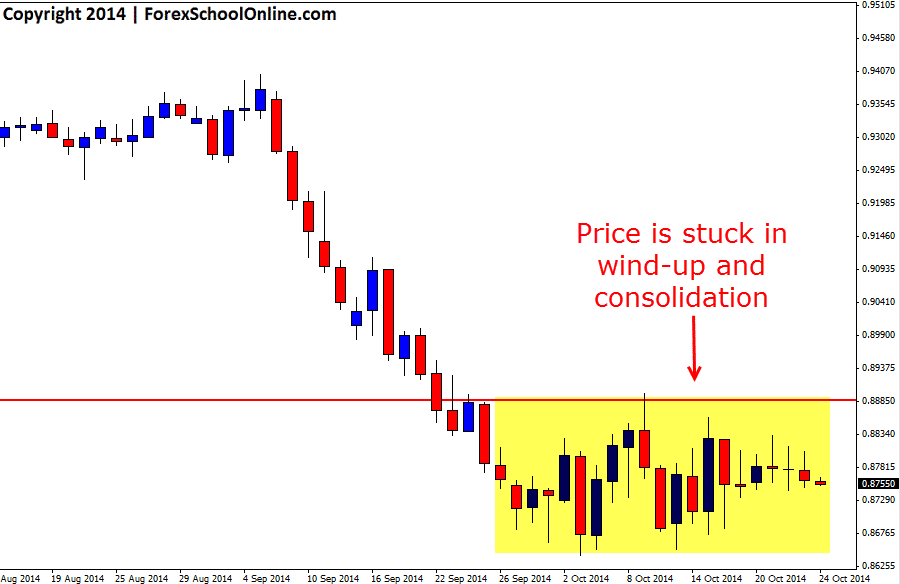
The AUDUSD is caught in a medium term wind-up on the daily price action chart with the previous three weeks of price action all caught in a sideways box as sown by the daily chart below. Price has traded sideways in a tight box and moved in a tight containment of 260 pips without being able to move higher or lower for over 20 days now which is extraordinary for a a currency pair.
This sideways and consolidation price action is making this market tricky for any traders who are looking to make trades in the short term. As I discuss in the trading tutorial Traders Need to Learn to Identity and Trade with Lower Volatility when price moves into a wind-up periods, less and less order flow gets put into the market because less and less traders see a good opportunity to make a quality trade. The problem with this is that the less order flow that gets put into the particular pair, the even less it moves and so the winding up tends to continue until something happens.
The good thing about tight wind-up periods is that the longer price winds up, normally the stronger the breakout will be when it eventually does occur and when this breakout does happen traders could be presented with high probability trading opportunity so traders should be keeping a close eye on this one.
AUDUSD Daily Chart

EURGBP Breaks Lower From 2 Day Pin Bar
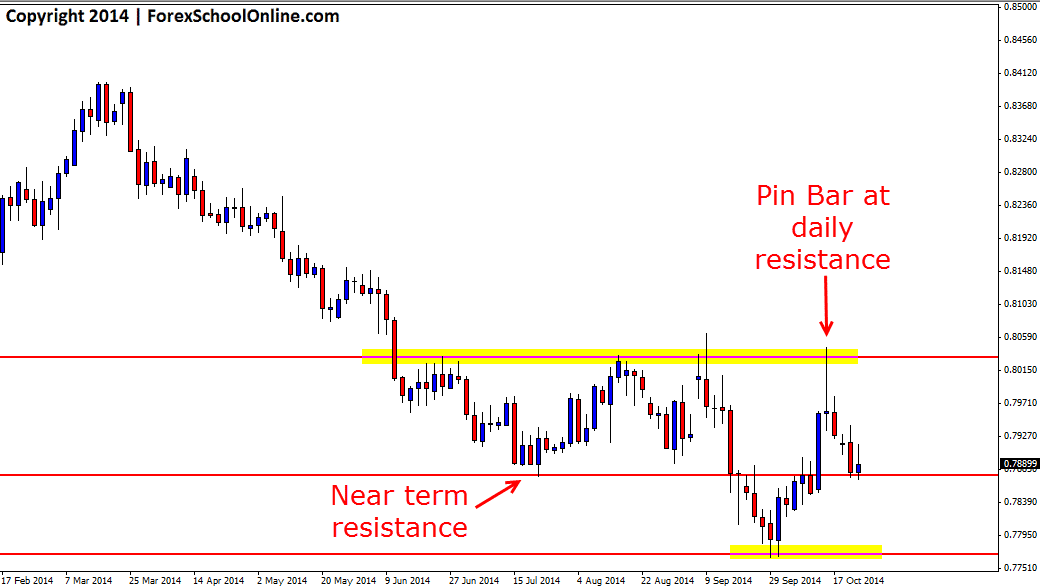
The EURGBP has broken lower from the 2 day pin bar that had formed and now price has moved into the near term support. This pin bar was a large pin bar that had a large nose sticking out and rejecting the key daily resistance. Price has been caught in a range on this pair for the previous few months, but the levels are clear and clean and this makes trading a lot easier compared to the other markets where the ranges and sideways trading don’t have clear designated levels to either hunt or manage trades.
If price can break this support that price is sitting on now the next major support looks to come in around the swing low area.
NOTE: If you want to learn how to make different time frame charts like the 2 day chart below or any other time frame you want with your MT4 charts, then read the trading lesson here;
Change MT4 Time Frame to What You Want Indicator Ea
EURGBP Daily Chart

Related Forex Trading Education
– If You Want to Win at Forex, You Have to Learn to Lose!


Leave a Reply