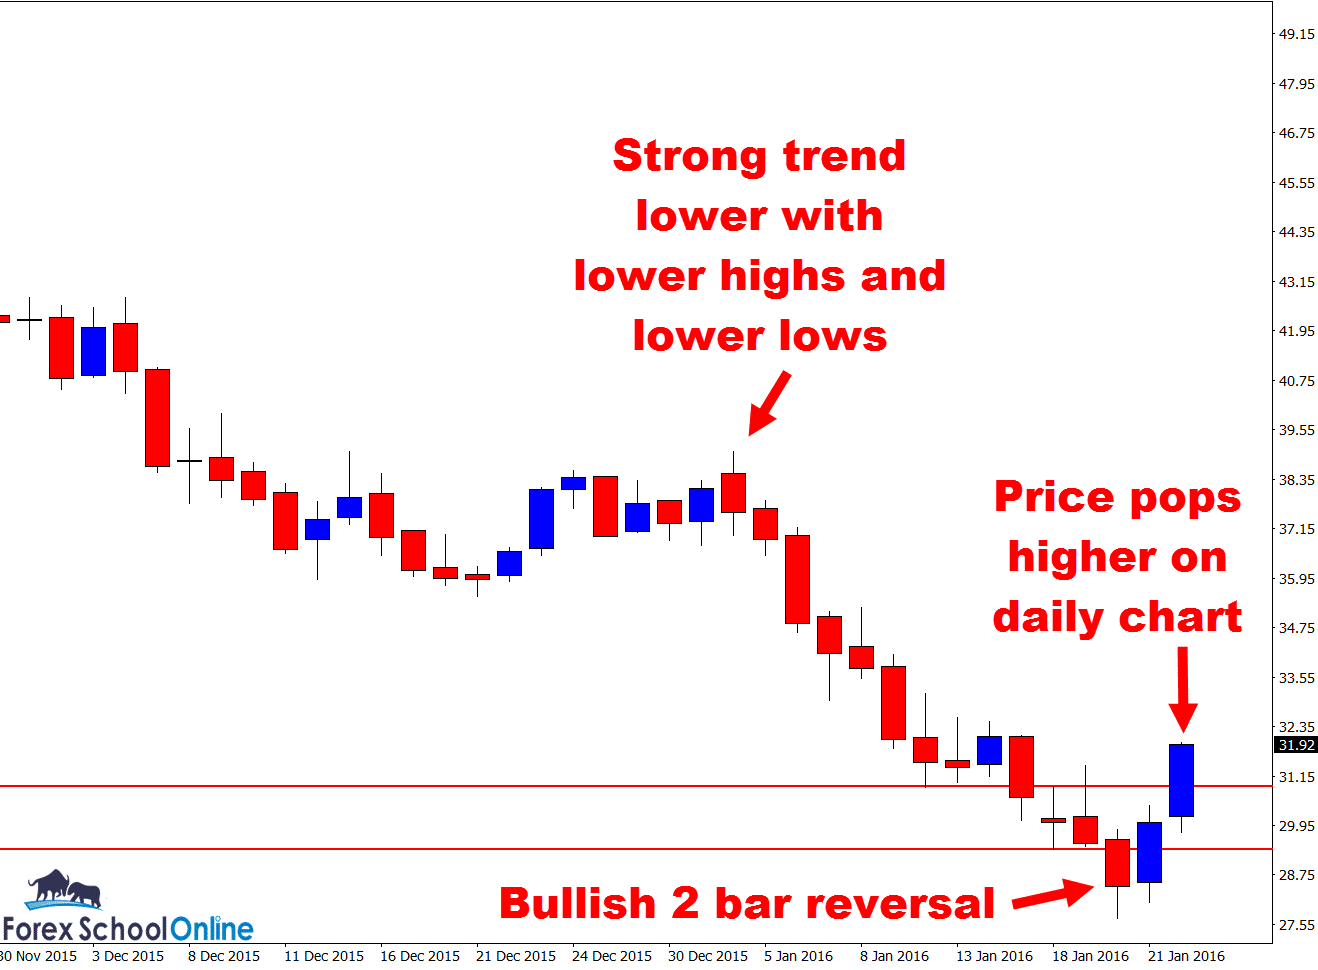
Price in the Crude oil market has been getting crushed for months on end now. Every higher time frame you flip to from the intraday 4 hour, 8 hour and daily chart is showing clear and strong down-trends with series of lower lows and lower highs.
Price has now been crunched so severely that it is back testing lows that have not been seen in over ten years. What to do in markets such as these?
What is the highest probability play and the best way to make money with really obvious trends in the Forex market? Try to pick the top and bottom of the trend and see how close you can get to picking the trend finishing? Ummm, no! That is what a lot of traders do though.
The best, highest probability way hands down is to trade with the strong trend in your favor and to continue trading with the trend over and over, until the market shows you otherwise.
DO NOT out-think either yourself or the market.
What do I mean by that? A lot of traders start to think “boy, this trend has gone a long way now, surely it can’t go any further, I should start trading the opposite way now”! WHAT!!
Look and read the price action in front of you. Trade only what you see on the chart (not what you think you should be seeing). If the price action says change course and trade the other way, THEN, trade the other way, but until then, continue trading with the trend.
I was discussing way back in August how we should be short trading this market with the strong down-trend with the Daily Forex Commentary;
WTI Oil Fires Off Double Time Frame Bearish Engulfing Bars | 6th Aug 2015
If we look at price as I write this just now on the daily chart, price has just popped higher and above a price flip level. Price is attempting to reverse and make a push back higher.
What is often misunderstood about trend reversals is how they actually form and the price action order flow behind them. If you understand this, you may hunt your trades from a whole different perspective.
Trend reversals i,e price changing from a down-trend to moving back higher or vice versa, very rarely will be started by just one candle. In other words; it is super rare for price to just up and turn around in one candle.
Think of it like this; you have the whole trend, in this case the down-trend. All the momentum and sellers/bears. For price to reverse it needs the other team to take control > the bulls/buyers. This is extremely rare for the buyers/bulls to just snatch all the control and order flow in ONE CANDLE and then just waltz back higher doing what they like!
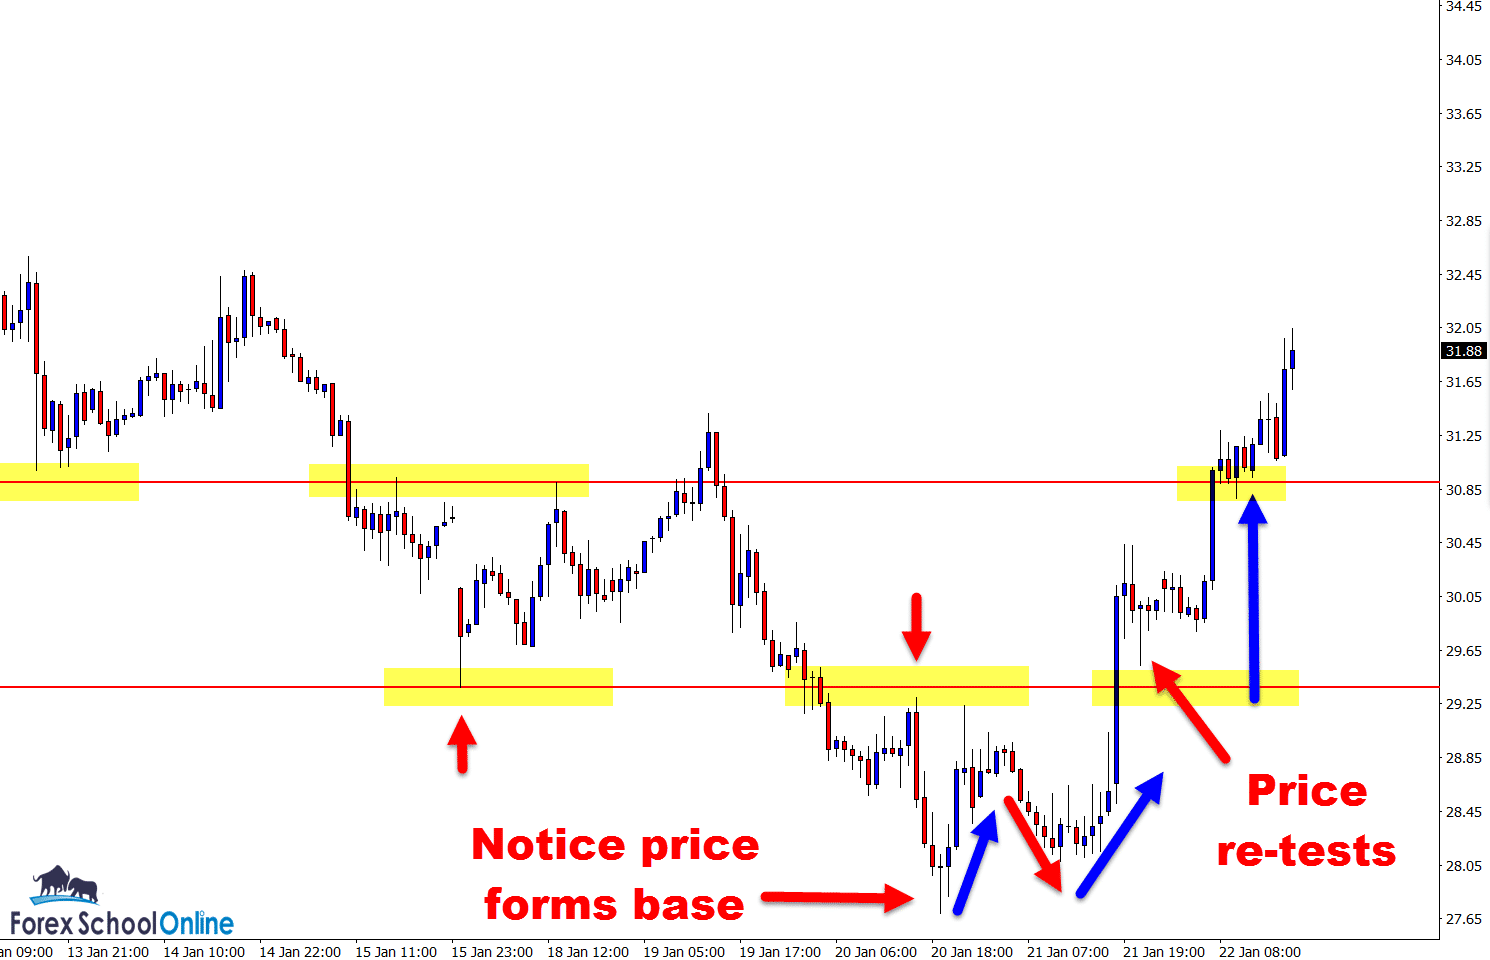
Look at the 1 hour chart below; it is a great example of the anatomy of a Forex reversal.
Firstly; take note at how price makes a strong push higher and a first attempt at reversing the trend. This is the bulls/buyers strong attempt to rip control and run away with the prize/trend. The trend is intact and obviously the bears/sellers come back in strongly.
> Notice how the second strong push higher by the bulls/buyers has a couple of MAJOR differences!
1: It had a higher low! In other words; the second push higher is now starting to make higher lows, rather than continue the down-trend of lower lows and lower highs.
2: It closed ABOVE the intraday price flip level which was crucial battle territory. You will also note that price also then flipped and held as support.
If you have any questions please just post them in the comments section below.
[Important Note] Learn the 7 major steps to high probability trade setups and how you can use the same checklist and formula!

Daily Chart – Strong Daily Trend Lower

1 Hour Chart – Price Action Intraday Trend Reversal

Related Forex Trading Education


Leave a Reply